Chrysler 2014 Annual Report Download - page 242
Download and view the complete annual report
Please find page 242 of the 2014 Chrysler annual report below. You can navigate through the pages in the report by either clicking on the pages listed below, or by using the keyword search tool below to find specific information within the annual report.-
 1
1 -
2
-
3
-
4
-
5
-
6
-
7
-
8
-
9
-
10
-
11
-
12
-
13
-
14
-
15
-
16
-
17
-
18
-
19
-
20
-
21
-
22
-
23
-
24
-
25
-
26
-
27
-
28
-
29
-
30
-
31
-
32
-
33
-
34
-
35
-
36
-
37
-
38
-
39
-
40
-
41
-
42
-
43
-
44
-
45
-
46
-
47
-
48
-
49
-
50
-
51
-
52
-
53
-
54
-
55
-
56
-
57
-
58
-
59
-
60
-
61
-
62
-
63
-
64
-
65
-
66
-
67
-
68
-
69
-
70
-
71
-
72
-
73
-
74
-
75
-
76
-
77
-
78
-
79
-
80
-
81
-
82
-
83
-
84
-
85
-
86
-
87
-
88
-
89
-
90
-
91
-
92
-
93
-
94
-
95
-
96
-
97
-
98
-
99
-
100
-
101
-
102
-
103
-
104
-
105
-
106
-
107
-
108
-
109
-
110
-
111
-
112
-
113
-
114
-
115
-
116
-
117
-
118
-
119
-
120
-
121
-
122
-
123
-
124
-
125
-
126
-
127
-
128
-
129
-
130
-
131
-
132
-
133
-
134
-
135
-
136
-
137
-
138
-
139
-
140
-
141
-
142
-
143
-
144
-
145
-
146
-
147
-
148
-
149
-
150
-
151
-
152
-
153
-
154
-
155
-
156
-
157
-
158
-
159
-
160
-
161
-
162
-
163
-
164
-
165
-
166
-
167
-
168
-
169
-
170
-
171
-
172
-
173
-
174
-
175
-
176
-
177
-
178
-
179
-
180
-
181
-
182
-
183
-
184
-
185
-
186
-
187
-
188
-
189
-
190
-
191
-
192
-
193
-
194
-
195
-
196
-
197
-
198
-
199
-
200
-
201
-
202
-
203
-
204
-
205
-
206
-
207
-
208
-
209
-
210
-
211
-
212
-
213
-
214
-
215
-
216
-
217
-
218
-
219
-
220
-
221
-
222
-
223
-
224
-
225
-
226
-
227
-
228
-
229
-
230
-
231
-
 232
232 -
 233
233 -
 234
234 -
 235
235 -
 236
236 -
 237
237 -
 238
238 -
 239
239 -
 240
240 -
 241
241 -
 242
242 -
 243
243 -
 244
244 -
 245
245 -
 246
246 -
 247
247 -
 248
248 -
 249
249 -
 250
250 -
 251
251 -
 252
252 -
253
-
254
-
255
-
256
-
257
-
258
-
259
-
260
-
261
-
262
-
263
-
264
-
265
-
266
-
267
-
268
-
269
-
270
-
271
-
272
-
273
-
274
-
275
-
276
-
277
-
278
-
279
-
280
-
281
-
282
-
283
-
284
-
285
-
286
-
287
-
288
-
289
-
290
-
291
-
292
-
293
-
294
-
295
-
296
-
297
-
298
-
299
-
300
-
301
-
302
-
303
 |
 |

240 2014 | ANNUAL REPORT
Consolidated
Financial Statements
Notes to the Consolidated
Financial Statements
The most significant financial transactions with related parties generated Receivables from financing activities of the
Group’s financial services companies from joint ventures and Asset-backed financing relating to amounts due to
FCA Bank for the sale of receivables which do not qualify for derecognition under IAS 39 – Financial Instruments:
Recognition and Measurement. At December 31, 2014 and at December 31, 2013, Receivables from financing
activities due from related parties also included receivables due from CNHI mainly arising from customer factoring
provided by the Group’s financial services companies. On the other hand, Debt due to related parties included certain
balances due to CNHI, mainly relating to factoring and dealer financing in Latin America.
In accordance with IAS 24, transactions with related parties also include compensation payable to Directors, Statutory
Auditors and managers with strategic responsibilities.
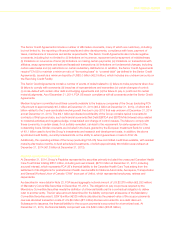
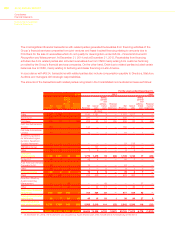
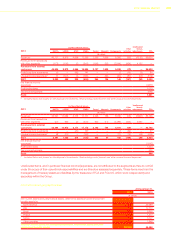
The amounts of the transactions with related parties recognized in the Consolidated income statement were as follows:
For the years ended December 31,
2014 2013 2012
Net
Revenues
Cost of
sales
Selling,
general
and
adminis-
trative
costs
Financial
income/
(expenses)
Net
Revenues
Cost of
sales
Selling,
general
and
adminis-
trative
costs
Financial
income/
(expenses)
Net
Revenues
Cost of
sales
Selling,
general
and
adminis-
trative
costs
Financial
income/
(expenses)
(€ million)
Tofas 1,247 1,189 1 — 1,145 1,287 3 — 1,115 1,227 4 —
Sevel S.p.A. 274 — 4 — 237 — 3 — 235 — — —
FCA Bank 276 10 7 (29) 223 62 10 (24) 200 82 12 (28)
GAC Fiat Automobiles
Co Ltd 153 — — — 144 — 1 — 150 — — —
Fiat India Automobiles
Limited 17 — — — 14 — 2 1 19 — 1 —
Société Européenne
de Véhicules Légers
du Nord- Sevelnord
Société Anonyme(*) — — — — — — — — 24 218 — —
VM Motori Group — — — — — 121 — — — 215 — —
Other 18 22 — — 7 6 — — 6 4 — —
Total joint
arrangements 1,985 1,221 12 (29) 1,770 1,476 19 (23) 1,749 1,746 17 (28)
To-dis S.r.l. 46 2 — — 48 4 — — 48 2 — —
Arab American Vehicles
Company S.A.E. 28 — — — 15 — — — 24 — — —
Other 28 — 6 — 7 — 5 — 6 1 7 —
Total associates 102 2 6 — 70 4 5 — 78 3 7 —
CNHI 602 492 — — 703 500 — — 676 452 1 —
Directors, Statutory
Auditors and Key
Management — — 89 — — — 49 — — — 57 —
Other — 4 20 — — 24 13 — 1 36 7 —
Total CNHI, Directors
and others 602 496 109 — 703 524 62 — 677 488 65 —
Total unconsolidated
subsidiaries 52 7 21 (1) 45 15 28 1 38 99 27 3
Total transactions
with related parties 2,741 1,726 148 (30) 2,588 2,019 114 (22) 2,542 2,336 116 (25)
Total for the Group 96,090 83,146 7,084 (2,047) 86,624 74,326 6,702 (1,987) 83,765 71,473 6,775 (1,910)
(*) At December 31, 2012, the Investment was classified as Asset held for sale, then transferred at the beginning of the 2013.