Chesapeake Energy 2011 Annual Report Download - page 6
Download and view the complete annual report
Please find page 6 of the 2011 Chesapeake Energy annual report below. You can navigate through the pages in the report by either clicking on the pages listed below, or by using the keyword search tool below to find specific information within the annual report.-
 1
1 -
 2
2 -
 3
3 -
 4
4 -
 5
5 -
 6
6 -
 7
7 -
 8
8 -
 9
9 -
 10
10 -
 11
11 -
 12
12 -
 13
13 -
 14
14 -
 15
15 -
 16
16 -
 17
17 -
18
-
19
-
20
-
21
-
22
-
23
-
24
-
25
-
26
-
27
-
28
-
29
-
30
-
31
-
32
-
33
-
34
-
35
-
36
-
37
-
38
-
39
-
40
-
41
-
42
-
43
-
44
-
45
-
46
-
47
-
48
-
49
-
50
-
51
-
52
 |
 |

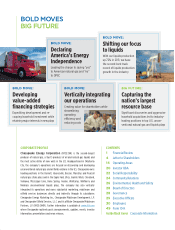
4 | Letter to Shareholders
The theme of this year’s annual report,
“Bold Moves, Big Future,” could also ac-
curately describe Chesapeake’s history.
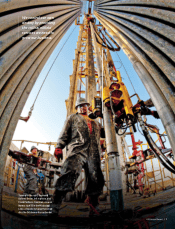
When Tom Ward and I co-founded the company
in May 1989, we had a bold idea — to take advan-
tage of the new technology of horizontal drilling
and apply that technology to fractured carbon-
ate reservoirs, a type of reservoir that today,
along with other tight rock formations, is called
unconventional. We followed with the equally
bold idea that land acquisition skills could even-
tually become a key competitive advantage in an
industry traditionally dominated by the geologi-
cal and engineering disciplines.
Since its founding 23 years ago on these two
bold ideas, Chesapeake’s innovative business
strategy and successful growth have been defined
by other bold moves, based on certain keen in-
sights, that have helped create a big future for
our company.
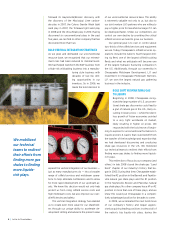
BOLD ACQUISITION GROWTH
In the depths of the oil and gas recession of early
1999, I developed the insight that U.S. natural gas
prices would likely move significantly and struc-
turally higher as electricity usage was likely to
increase at above average rates (because of the
growth of the Internet and the increasing size of
the average American home, among other fac-
tors). I realized a multitude of new natural gas-
fired power generation plants would need to be
built to meet this increased demand, but didn’t
believe the U.S. natural gas supply could keep up
with this increased demand. From 1999 to 2005,
that insight led the company to the bold moves of
acquiring as many natural gas assets as we could
and developing an organization capable of oper-
ating a large-scale drilling program.
In the beginning, we pursued this strategy
with limited financial resources amid a great
deal of industry, research analyst and investor
skepticism. Many observers of our company bet
that natural gas prices would increase to $3 per
thousand cubic feet (mcf) from $1 per mcf before
Chesapeake’s stock price would increase to $3
per share from $1 per share. Despite such skepti-
cism, we performed our research thoroughly and
were convinced the die was cast for U.S. natu-
ral gas prices to rise substantially. In fact, that is
exactly what they did, increasing from a low of
$1.67 per mcf in 1999 to a high of $13.91 per mcf
in 2005.
DEAR FELLOW
SHAREHOLDERS
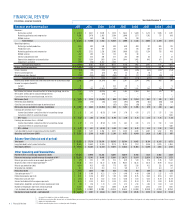
2011 Financial and Operational Highlights
Operating cash flow(2) increased 3% to $5.3 billion
Implemented and made significant progress toward the
company’s 25/25 Plan that calls for a 25% reduction in
long-term debt and a 25% increase in production over
the two-year period ending December 31, 2012
Announced discovery of the Utica Shale play in eastern Ohio
Significantly shifted drilling and completion capital to
liquids-rich plays
Monetized more than $7.0 billion of proved and
unproved properties including the complete exit from
the Fayetteville Shale in Arkansas
Made strategic investments in natural gas demand
creation initiatives
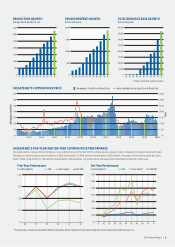
Average daily liquids production increased 72% from
50,000 bbls in 2010 to 87,000 bbls in 2011
Average daily natural gas production increased 9%
from 2.5 bcf in 2010 to 2.8 bcf in 2011
Proved natural gas and oil reserves increased 10% from
17.1 tcfe in 2010 to 18.8 tcfe in 2011
2011 reserve replacement reached 242% at a drilling
and completion cost on proved properties of only
$1.08 per mcfe(1)
Revenues increased 24% to $11.6 billion
Realized hedging gains were $1.6 billion
Adjusted ebitda(2) increased 6% to $5.4 billion