Chesapeake Energy 2011 Annual Report Download - page 3
Download and view the complete annual report
Please find page 3 of the 2011 Chesapeake Energy annual report below. You can navigate through the pages in the report by either clicking on the pages listed below, or by using the keyword search tool below to find specific information within the annual report.
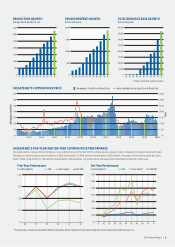
PROVED RESERVE GROWTH
Bcfe at end of year
PRODUCTION GROWTH
Average mmcfe per day for year
TOTAL RESOURCE BASE GROWTH
*
Bcfe at end of year
*Proved and unrisked, unproved resources
0
500
1,000
1,500
2,000
2,500
3,000
3,500
01 02 03 04 05 06 07 08 09 10 11 0
5,000
10,000
15,000
20,000
01 02 03 04 05 06 07 08 09 10 11
50,000
100,000
150,000
250,000
300,000
350,000
200,000
400,000
001 02 03 04 05 06 07 08 09 10 11
$ 0 DEC 01 DEC 02 DEC 03 DEC 04 DEC 05 DEC 06 DEC 07 DEC 08 DEC 09 DEC 10 DEC 11
CHK Common Stock Price
$ 0
$ 10 $ 2.50
$ 20 $ 5.00
$ 30 $7.50
$ 40 $ 10.00
$ 50 $ 12.50
$ 60 $ 15.00
$ 70 $ 17.50
$/mcf
CHESAPEAKE’S COMMON STOCK PRICE
Chesapeake’s Stock Price at Month End Henry Hub Natural Gas Spot Price at Month End
(1) The peer group is comprised of Anadarko Petroleum Corporation, Apache Corporation, Devon Energy Corporation, Encana Corporation and EOG Resources, Inc.
CHESAPEAKE’S FIVE-YEAR AND TEN-YEAR COMMON STOCK PERFORMANCE
The graphs below compare the performance of our common stock to the S&P 500 Stock Index and to a group of peer companies for the past five and 10 years.
The graph on the left assumes an investment of $100 on December 31, 2006 and the reinvestment of all dividends. The graph on the right assumes an invest-
ment of $100 on December 31, 2001 and the reinvestment of all dividends. The graphs show the value of the investment at the end of each year.
Ten-Year Performance
As of December 31 CHK Peer Group(1) S&P 500
01 03 05 07 0902 04 06 08 10 11
$ 0
$ 100
$ 200
$ 300
$ 400
$ 500
$ 600
$ 700
Five-Year Performance
As of December 31 CHK Peer Group(1) S&P 500
06 07 08 09 10 11
$
0
$
50
$
100
$
150
$
200
2011 Annual Report | 3


