Chesapeake Energy 2011 Annual Report Download - page 4
Download and view the complete annual report
Please find page 4 of the 2011 Chesapeake Energy annual report below. You can navigate through the pages in the report by either clicking on the pages listed below, or by using the keyword search tool below to find specific information within the annual report.-
 1
1 -
 2
2 -
 3
3 -
 4
4 -
 5
5 -
 6
6 -
 7
7 -
 8
8 -
 9
9 -
 10
10 -
 11
11 -
 12
12 -
 13
13 -
 14
14 -
 15
15 -
16
-
17
-
18
-
19
-
20
-
21
-
22
-
23
-
24
-
25
-
26
-
27
-
28
-
29
-
30
-
31
-
32
-
33
-
34
-
35
-
36
-
37
-
38
-
39
-
40
-
41
-
42
-
43
-
44
-
45
-
46
-
47
-
48
-
49
-
50
-
51
-
52
 |
 |

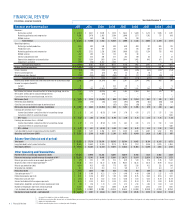
1 | Financial Review
Financial and Operating Data 2011 2010 2009 2008 2007 2006 2005 2004
FINANCIAL REVIEW
($ in millions, except per share data) Years Ended December 31
* See page 15 for definition of this non-GAAP measure.
** PV-10 is the present value (10% discount rate) of estimated future gross revenues to be generated from the production of proved reserves, net of production and future development costs, using assumed prices and co
s
*** Adjusted for field differentials.
**** Excludes unrealized gains (losses) on natural gas and oil hedging.
Revenues:
Natural gas and oil
$
6,024
$
5,647
$
5,049
$
7,858
$
5,624
$
5,619
$
3,273
$
1,936
Marketing, gathering and compression 5,090 3,479 2,463 3,598 2,040 1,577 1,392 773
Oilfield services 521 240 190 173 136 130 — —
Total revenues $ 11,635 $ 9,366 $ 7,702 $ 11,629 $ 7,800 $ 7,326 $ 4,665 $ 2,709
Operating expenses:
Natural gas and oil production 1,073 893 876 889 640 490 317 205
Production taxes 192 157 107 284 216 176 208 104
Marketing, gathering and compression 4,967 3,352 2,316 3,505 1,969 1,522 1,358 755
Oilfield services 402 208 182 143 94 68 — —
General and administrative 548 453 349 377 243 139 64 37
Depreciation, depletion and amortization 1,923 1,614 1,615 2,144 1,988 1,462 945 611
Impairments and other (391 ) (116 ) 11,202 2,830 — 55 — 5
Total operating expenses 8,714 6,561 16,647 10,172 5,150 3,912 2,892 1,717
Income (loss) from operations 2,921 2,805 (8,945 ) 1,457 2,650 3,414 1,773 992
Interest expense (44 ) (19 ) (113 ) (271 ) (401 ) (316 ) (221 ) (167 )
Other income (expense) 179 243 (28 ) (11 ) 15 26 10 5
Miscellaneous gains (losses) (176 ) (145 ) (202 ) (184 ) 83 117 (70 ) (25 )
Total other income (expense) (41 ) 79 (343 ) (466 ) (303 ) (173 ) (281 ) (187 )
Income (loss) before income taxes and cumulative effect of accounting change 2,880 2,884 (9,288 ) 991 2,347 3,241 1,492 805
Income tax expense (benefit):
Current 13 — 4 423 29 5 — —
Deferred 1,110 1,110 (3,487 ) (36 ) 863 1,242 545 290
Net income (loss) before cumulative effect of accounting change, net of tax 1,757 1,774 (5,805 ) 604 1,455 1,994 947 515
Net income attributable to noncontrolling interests (15 ) — (25 ) — — — — —
Cumulative effect of accounting change, net of tax — — — — — — — —
Net income (loss) $ 1,742 $ 1,774 $ (5,830 ) $ 604 $ 1,455 $ 1,994 $ 947 $ 515
Preferred stock dividends (172 ) (111 ) (23 ) (33 ) (94 ) (89 ) (42 ) (40 )
Gain (loss) on conversion/exchange of preferred stock — — — (67 ) (128 ) (10 ) (26 ) (36 )
Net income (loss) available to common stockholders $ 1,570 $ 1,663 $ (5,853 ) $ 504 $ 1,233 $ 1,895 $ 879 $ 439
Earnings per common share – basic:
Income (loss) before cumulative effect of accounting change
$
2.47
$
2.63
$
(9.57 )
$
0.94
$
2.70
$
4.76
$
2.73
$
1.73
Cumulative effect of accounting change — — — — — — — —
EPS – basic $ 2.47 $ 2.63 $ (9.57 ) $ 0.94 $ 2.70 $ 4.76 $ 2.73 $ 1.73
Earnings per common share – diluted:
Income (loss) before cumulative effect of accounting change
$
2.32
$
2.51
$
(9.57 )
$
0.93
$
2.63
$
4.33
$
2.51
$
1.53
Cumulative effect of accounting change — — — — — — — —
EPS – diluted $ 2.32 $ 2.51 $ (9.57 ) $ 0.93 $ 2.63 $ 4.33 $ 2.51 $ 1.53
Cash provided by (used in) operating activities (GAAP)
$
5,903
$
5,117
$
4,356
$
5,357
$
4,974
$
4,843
$
2,407
$
1,432
Operating cash flow (non-GAAP)* $ 5,309 $ 5,168 $ 4,487 $ 5,299 $ 4,675 $ 4,040 $ 2,426 $ 1,403
Balance Sheet Data (at end of period)
Total assets $ 41,835 $ 37,179 $ 29,914 $ 38,593 $ 30,764 $ 24,413 $ 16,114 $ 8,245
Long-term debt, net of current maturities
$
10,626
$
12,640
$
12,295
$
13,175
$
10,178
$
7,187
$
5,286
$
3,075
Total equity (deficit) $ 17,961 $ 15,264 $ 12,341 $ 17,017 $ 12,624 $ 11,366 $ 6,299 $ 3,163
Other Operating and Financial Data
Proved reserves in natural gas equivalents (bcfe) 18,789 17,096 14,254 12,051 10,879 8,956 7,521 4,902
Future net natural gas and oil revenues discounted at 10%** $ 19,878 $ 15,146 $ 9,449 $ 15,601 $ 20,573 $ 13,647 $ 22,934 $ 10,504
Natural gas price used in reserve report (per mcf)***
$
3.19
$
3.52
$
3.13
$
5.12
$
6.19
$
5.41
$
8.76
$
5.65
Oil price used in reserve report (per bbl)***
$
88.50
$
75.17
$
56.72
$
41.60
$
90.58
$
56.25
$
56.41
$
39.91
Natural gas production (bcf) 1,004 925 835 775 655 526 422 322
Oil production (mmbbl) 31.7 18.4 11.8 11.2 9.9 8.7 7.7 6.8
Production (bcfe) 1,194 1,035 906 843 714 578 469 363
Sales price per mcfe****
$
5.70
$
6.09
$
6.22
$
8.38
$
8.40
$
8.86
$
6.90
$
5.23
Production expense per mcfe
$
0.90
$
0.86
$
0.97
$
1.05
$
0.90
$
0.85
$
0.68
$
0.56
Production taxes per mcfe
$
0.16
$
0.15
$
0.12
$
0.34
$
0.30
$
0.31
$
0.44
$
0.29
General and administrative expense per mcfe
$
0.46
$
0.44
$
0.38
$
0.45
$
0.34
$
0.24
$
0.14
$
0.10
Depreciation, depletion and amortization expense per mcfe
$
1.61
$
1.56
$
1.78
$
2.55
$
2.78
$
2.53
$
2.02
$
1.69
Number of employees (full-time at end of period) 12,598 10,021 8,152 7,649 6,219 4,883 2,885 1,718
Cash dividends declared per common share
$
0.3375
$
0.3000
$
0.3000
$
0.2925
$
0.2625
$
0.2300
$
0.1950
$
0.1700
Stock price (at end of period – split adjusted) $ 22.29 $ 25.91 $ 25.88 $ 16.17 $ 39.20 $ 29.05 $ 31.73 $ 16.50
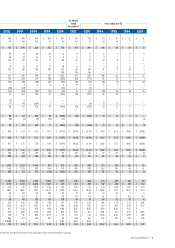
2003 200
s
ts. Please see pages 15
$
1,297
420
—
$ 1,717
138
78
410
—
24
386
6
1,042
675
(154 )
1
(21 )
(174 )
501
5
185
311
—
2
$ 313
(22 )
—
$ 291
$
1.36
0.02
$ 1.38
$
1.20
0.01
$ 1.21
$
939
$ 897
$ 4,572
$
2,058
$ 1,733
3,169
$ 7,333
$
5.68
$
30.22
240
4.7
268
$
4.79
$
0.51
$
0.29
$
0.09
$
1.44
1,192
$
0.1350
$ 13.58