Chesapeake Energy 2005 Annual Report Download - page 5
Download and view the complete annual report
Please find page 5 of the 2005 Chesapeake Energy annual report below. You can navigate through the pages in the report by either clicking on the pages listed below, or by using the keyword search tool below to find specific information within the annual report.-
 1
1 -
 2
2 -
 3
3 -
 4
4 -
 5
5 -
 6
6 -
 7
7 -
 8
8 -
 9
9 -
 10
10 -
 11
11 -
 12
12 -
 13
13 -
 14
14 -
 15
15 -
 16
16 -
17
-
18
-
19
-
20
-
21
-
22
-
23
 |
 |

•Was one of the top financial and
operating performers among
exploration and production
companies;
•Increased average daily produc-
tion 30% to 1,284 mmcfe and
delivered 12% organic produc-
tion growth;
•Increased proved reserves
by 53% to 7.5 tcfe through both
acquisitions and the drillbit;
•Replaced 659% of its produc-
tion, with a drillbit finding and
development cost of $1.74 per
mcfe and a total reserve replace-
ment cost of $2.40 per mcfe;
•Was the most active driller of
new wells in the U.S., drilling
902 operated wells and partici-
pating in another 1,066 non-
operated wells, utilizing an
average rig count of 73 operated
rigs and 66 non-operated rigs;
•Was one of the most active
consolidators in the industry,
investing $4.9 billion in acquisi-
tions of oil and gas properties
for the year and $10.3 billion
since 1998;
•Increased its industry leading
inventories of U.S. onshore
acreage and 3-D seismic data
to 7.9 million net acres and 11.6
million acres, respectively;
•More than doubled its market
capitalization and enterprise
value to $14 billion and $20
billion, respectively; and
•Generated a 94% total return
to common shareholders and
increased the total return to
common shareholders since its
IPO in 1993 to nearly 2,300%.
IN 2005, CHESAPEAKE:
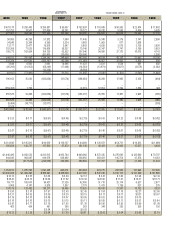
$2.38
153%
$10.12
325% $6.61
-35%
$7.74
17%
$13.58
75%
$16.50
22%
$31.73
92%
$0.94
-87%
$7.50
-73%
$27.41
151%
$10.92
217%
$3.45
563%*
1376/93
142 3%*6/94
243 71%6/95
425 75%6/96
403 -5%6/97
448 11%12/97
1,091 143%12/98
1,206 10%12/99
1,355 12%12/00
1,780 31%12/01
2,205 24%12/02
3,169 44%
12/03
4,902 55%12/04
7,521 53%12/05
126/93
28 134%*6/94
88 215%6/95
164 88%6/96
215 31%6/97
209 -3%12/97
357 71%12/98
366 2%12/99
367 0%12/00
442 21%12/01
497 12%12/02
735 48%12/03
991 35%12/04
1,284 30%12/05
2.066/93
2.13 3%*6/94
1.63 -23%6/95
2.18 34%6/96
2.65 5%12/97
2.11 -20%12/98
2.27 8%12/99
3.88 71%12/00
4.26 10%12/01
3.22 -24%12/02
5.38 67%12/03
6.13 14%12/04
8.64 41%12/05
2.53 16%6/97
* % change compared to prior period.
PRODUCTION GROWTH IN MMCFE PER DAY
PROVED RESERVES GROWTH IN BCFE
AVERAGE NYMEX NATURAL GAS PRICES $ PER MMBTU
05040302010099989796959493
CHESAPEAKE’S STOCK PRICE DECEMBER 31, SPLIT ADJUSTED
$0.52