Charles Schwab 2008 Annual Report Download - page 11
Download and view the complete annual report
Please find page 11 of the 2008 Charles Schwab annual report below. You can navigate through the pages in the report by either clicking on the pages listed below, or by using the keyword search tool below to find specific information within the annual report.
9
-
Note: All amounts are presented on a continuing operations basis to exclude the impact of the sale of U.S. Trust Corporation, which was completed on July ,2007.
(1) Excludes all proprietary money market, equity, and bond funds.
(2) Includes inflows of $7.8 billion in 2007 related to the acquisition of The 40(k) Company. Includes inflows of $3.3 billion, $3.6 billion, and $6.0 billion in 2007, 2006, and 2004
respectively, related to a mutual fund clearing services client. Includes an outflow of $9.5 billion in 2006 related to a mutual fund clearing services client who completed the
transfer of these assets to an internal platform. Effective 2007, amount includes balances covered by 40(k) record keeping-only services, which totaled $5.2 billion at May 3,2007, related to
the March 2007 acquisition of The 40(k) Company.
(3) Effective 2007, amounts include the Company’s mutual fund clearing services business’ daily net settlements, with a corresponding change in net market gains (losses). All prior period amounts
have been recast to reflect this change.
(4) Periodically, the Company reviews its active account base. The Company identified over 400,000 brokerage accounts that met its current definition of active, but had little
or no balances and no likelihood of further activity. Effective March 3,2006, the Company removed these accounts from its active brokerage account total. Amounts for
periods prior to 2006 were not adjusted. While the Company adjusted its definition of an active brokerage account to exclude certain zero and minimal balance accounts,
the basic definition remains “accounts with balances or activity within the preceding 8 months.”
(5) 2007 includes increases of 398,000 related to the acquisition of The 40(k) Company and 00,000 related to Personal Choice Retirement participants at Schwab.
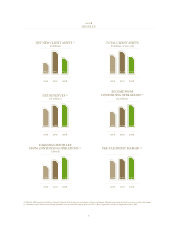
GROWTH IN CLIENT ASSETS & ACCOUNTS
2004-08 2007-08 2008 2007 2006 2005 2004
GROWTH RATES
ANNUAL
-YEAR
COMPOUNDED
4-YEAR
Assets in Client Accounts
Schwab One®, other cash equivalents
and deposits from banking clients 9% 24% $ 44.4 $ 35.9 $ 3.0 $ 3.3 $ 3.7
Proprietary funds (Schwab Funds®
and Laudus Funds®):
Money market funds 18% 15% 209.7 83. 35.0 0.6 07.0
Equity and bond funds 1% (42% ) 33.9 58.7 56.2 39.2 33.0
Total proprietary funds 15% 1% 243.6 24.8 9.2 49.8 40.0
Mutual Fund Marketplace® (1):
Mutual Fund OneSource® (4% ) (39% ) 110.6 80.9 63.2 37.8 29.7
Mutual fund clearing services 5% (34% ) 54.2 8.8 62. 60.2 44.2
Other third-party mutual funds 10% (25% ) 169.1 225.7 73. 42.7 4.4
Total Mutual Fund Marketplace 4% (32% ) 333.9 488.4 398.4 340.7 288.3
Total mutual fund assets 8% (21% ) 577.5 730.2 589.6 490.5 428.3
Equity and other securities (1) (2% ) (34% ) 357.2 545.2 487.0 422.4 387.3
Fixed income securities 12% 13% 164.1 45.8 42.0 9.7 04.5
Margin loans outstanding (11% )(47% ) (6.2) (.6)(0.4) (0.4) (9.8)
Total client assets 5% (21% ) $ 1,137.0 $ ,445.5 $ ,239.2 $ ,053.5 $ 942.0
Client Assets by Business
Investor Services (23% ) $ 482.6 $ 625.3 $ 567.5 $ 507.8 $ 485.3
Advisor Services 8% (18% ) 477.2 583.5 502.5 407.0 348.2
Corporate & Retirement Services 13% (25% ) 177.2 236.7 69.2 38.7 08.5
Total client assets by business 5% (21% ) $ 1,137.0 $ ,445.5 $ ,239.2 $ ,053.5 $ 942.0
Net Growth in Assets in Client Accounts
(for the year ended)
Net new assets
Investor Services 43% (9% ) $ 35.1 $ 38.6 $ 26.7 $ 6.3 $ 8.4
Advisor Services 16% (8% ) 60.2 65.6 5.4 42. 32.7
Corporate & Retirement Services 4% (68% ) 18.1 56.0 5.2 2.2 5.6
Total net new client assets (2, 3) 19% (29% ) $ 113.4 $ 60.2 $ 83.3 $ 79.6 $ 56.7
Net market (losses) gains (3) (421.9) 46. 02.4 3.9 54.6
Net (decline) growth $ (308.5) $ 206.3 $ 85.7 $ .5 $ .3
New Brokerage Accounts
(in thousands, for the year ended) 13% 10% 889 809 655 568 538
Clients (in thousands) (4)
Active Brokerage Accounts 1% 5% 7,401 7,049 6,737 7,049 7,252
Banking Accounts N/A 71% 447 262 47 N/A N/A
Corporate Retirement Plan Participants (5) N/A 17% 1,407 ,205 542 N/A N/A
(In Billions, at Year End, Except as Noted)

