Charles Schwab 2008 Annual Report Download - page 10
Download and view the complete annual report
Please find page 10 of the 2008 Charles Schwab annual report below. You can navigate through the pages in the report by either clicking on the pages listed below, or by using the keyword search tool below to find specific information within the annual report.-
 1
1 -
 2
2 -
 3
3 -
 4
4 -
 5
5 -
 6
6 -
 7
7 -
 8
8 -
 9
9 -
 10
10 -
 11
11 -
 12
12 -
 13
13 -
 14
14 -
 15
15 -
 16
16 -
 17
17 -
 18
18 -
 19
19 -
 20
20 -
 21
21 -
22
-
23
-
24
-
25
-
26
-
27
-
28
-
29
-
30
-
31
-
32
-
33
-
34
-
35
-
36
-
37
-
38
-
39
-
40
-
41
-
42
-
43
-
44
-
45
-
46
-
47
-
48
-
49
-
50
-
51
-
52
-
53
-
54
-
55
-
56
-
57
-
58
-
59
-
60
-
61
-
62
-
63
-
64
-
65
-
66
-
67
-
68
-
69
-
70
-
71
-
72
-
73
-
74
-
75
-
76
-
77
-
78
-
79
-
80
-
81
-
82
-
83
-
84
-
85
-
86
-
87
-
88
-
89
-
90
-
91
-
92
-
93
-
94
-
95
-
96
-
97
-
98
-
99
-
100
-
101
-
102
-
103
-
104
-
105
-
106
-
107
-
108
-
109
-
110
-
111
-
112
-
113
-
114
-
115
-
116
-
117
-
118
-
119
-
120
-
121
-
122
-
123
-
124
 |
 |

8
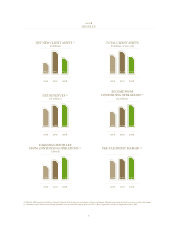
FINANCIAL HIGHLIGHTS
Net revenues 3% $ 5,150 $ 4,994 $ 4,309
Expenses excluding interest (1% ) $ 3,122 $ 3,4 $ 2,833
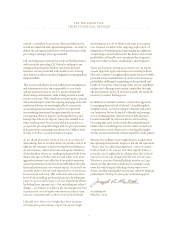
Net income N/M $ 1,212 $ 2,407 $ ,227
Income from continuing
operations per share – basic 15% $ 1.07 $ 0.93 $ 0.70
Income from continuing
operations per share – diluted 15% $ 1.06 $ 0.92 $ 0.69
Basic earnings per share N/M $ 1.06 $ .99 $ 0.97
Diluted earnings per share N/M $ 1.05 $ .97 $ 0.95
Dividends declared per common share 10% $ 0.220 $ 0.200 $ 0.35
Special dividend per common share N/M $ - $ .00 $ -
Weighted-average common shares
outstanding – diluted (5% ) 1,157 ,222 ,286
Closing market price per share (at year end) (37% ) $ 16.17 $ 25.55 $ 9.34
Book value per common share (at year end) 9% $ 3.51 $ 3.22 $ 3.96
Net revenue growth 3% 6% 9%
Pre-tax profit margin from continuing operations 39.4% 37.% 34.3%
Return on stockholders’ equity 31% 55% 26%
Full-time equivalent employees
(at year end, in thousands) 1% 13.4 3.3 2.4
Net revenues per average
full-time equivalent employee (in thousands) (1% ) $ 383 $ 387 $ 362
Note: All amounts are presented on a continuing operations basis to exclude the impact of the sale of U.S. Trust Corporation, which was completed on July ,2007.
N/M Not Meaningful.
2007-08 2008 2007 2006
GROWTH RATE
-YEAR
(In Millions, Except Per Share Amounts, Ratios, or as Noted) 2008