CenturyLink 2005 Annual Report Download - page 23
Download and view the complete annual report
Please find page 23 of the 2005 CenturyLink annual report below. You can navigate through the pages in the report by either clicking on the pages listed below, or by using the keyword search tool below to find specific information within the annual report.-
 1
1 -
2
-
3
-
4
-
5
-
6
-
7
-
8
-
9
-
10
-
11
-
12
-
 13
13 -
 14
14 -
 15
15 -
 16
16 -
 17
17 -
 18
18 -
 19
19 -
 20
20 -
 21
21 -
 22
22 -
 23
23 -
 24
24 -
 25
25 -
 26
26 -
 27
27 -
 28
28
 |
 |
21
Year ended December 31,
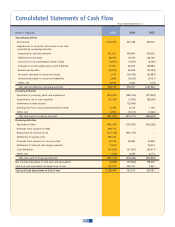
Consolidated Statements of Cash Flow
Dollars in thousands 2005 2004 2003
Operating Activities
Net Income $ 334,479 337,244 344,707
Adjustments to reconcile net income to net cash
provided by operating activities
Depreciation and amortization 531,931 500,904 503,652
Deferred income taxes 69,530 74,374 128,706
Income from unconsolidated cellular entity (4,910) (7,067) (6,160)
Changes in current assets and current liabilities 27,001 58,322 160,984
Retirement benefits (16,815) 26,954 (14,739)
(Increase) decrease in noncurrent assets 1,973 (34,740) (42,880)
Increase (decrease) in noncurrent liabilities 2,638 (6,220) (6,151)
Other, net 18,912 6,060 (155)
Net cash provided by operating activities 964,739 955,831 1,067,964
Investing Activities
Payments for property, plant and equipment (414,872) (385,316) (377,939)
Acquisitions, net of cash acquired (75,453) (2,000) (86,243)
Investment in debt security – (25,000) –
Distributions from unconsolidated cellular entity 2,339 8,219 1,104
Other, net 6,594 (9,214) (1,560)
Net cash used in investing activities (481,392) (413,311) (464,638)
Financing Activities
Payments of debt (693,345) (179,393) (432,258)
Proceeds from issuance of debt 344,173 – –
Repurchase of common stock (551,759) (401,013) –
Settlement of equity units 398,164 – –
Proceeds from issuance of common stock 50,374 29,485 33,980
Settlement of interest rate hedge contracts (7,357) – 22,315
Cash dividends (31,862) (31,861) (32,017)
Other, net (104) 4,296 4,174
Net cash used in financing activities (491,716) (578,486) (403,806)
Net increase (decrease) in cash and cash equivalents (8,369) (35,966) 199,520
Cash and cash equivalents at beginning of year 167,215 203,181 3,661
Cash and Cash Equivalents at End of Year $ 158,846 167,215 203,181