CenturyLink 2005 Annual Report Download - page 19
Download and view the complete annual report
Please find page 19 of the 2005 CenturyLink annual report below. You can navigate through the pages in the report by either clicking on the pages listed below, or by using the keyword search tool below to find specific information within the annual report.-
 1
1 -
2
-
3
-
4
-
5
-
6
-
7
-
8
-
 9
9 -
 10
10 -
 11
11 -
 12
12 -
 13
13 -
 14
14 -
 15
15 -
 16
16 -
 17
17 -
 18
18 -
 19
19 -
 20
20 -
 21
21 -
 22
22 -
 23
23 -
 24
24 -
 25
25 -
 26
26 -
 27
27 -
 28
28
 |
 |
17
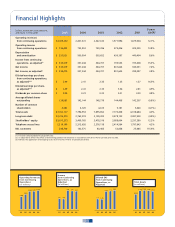
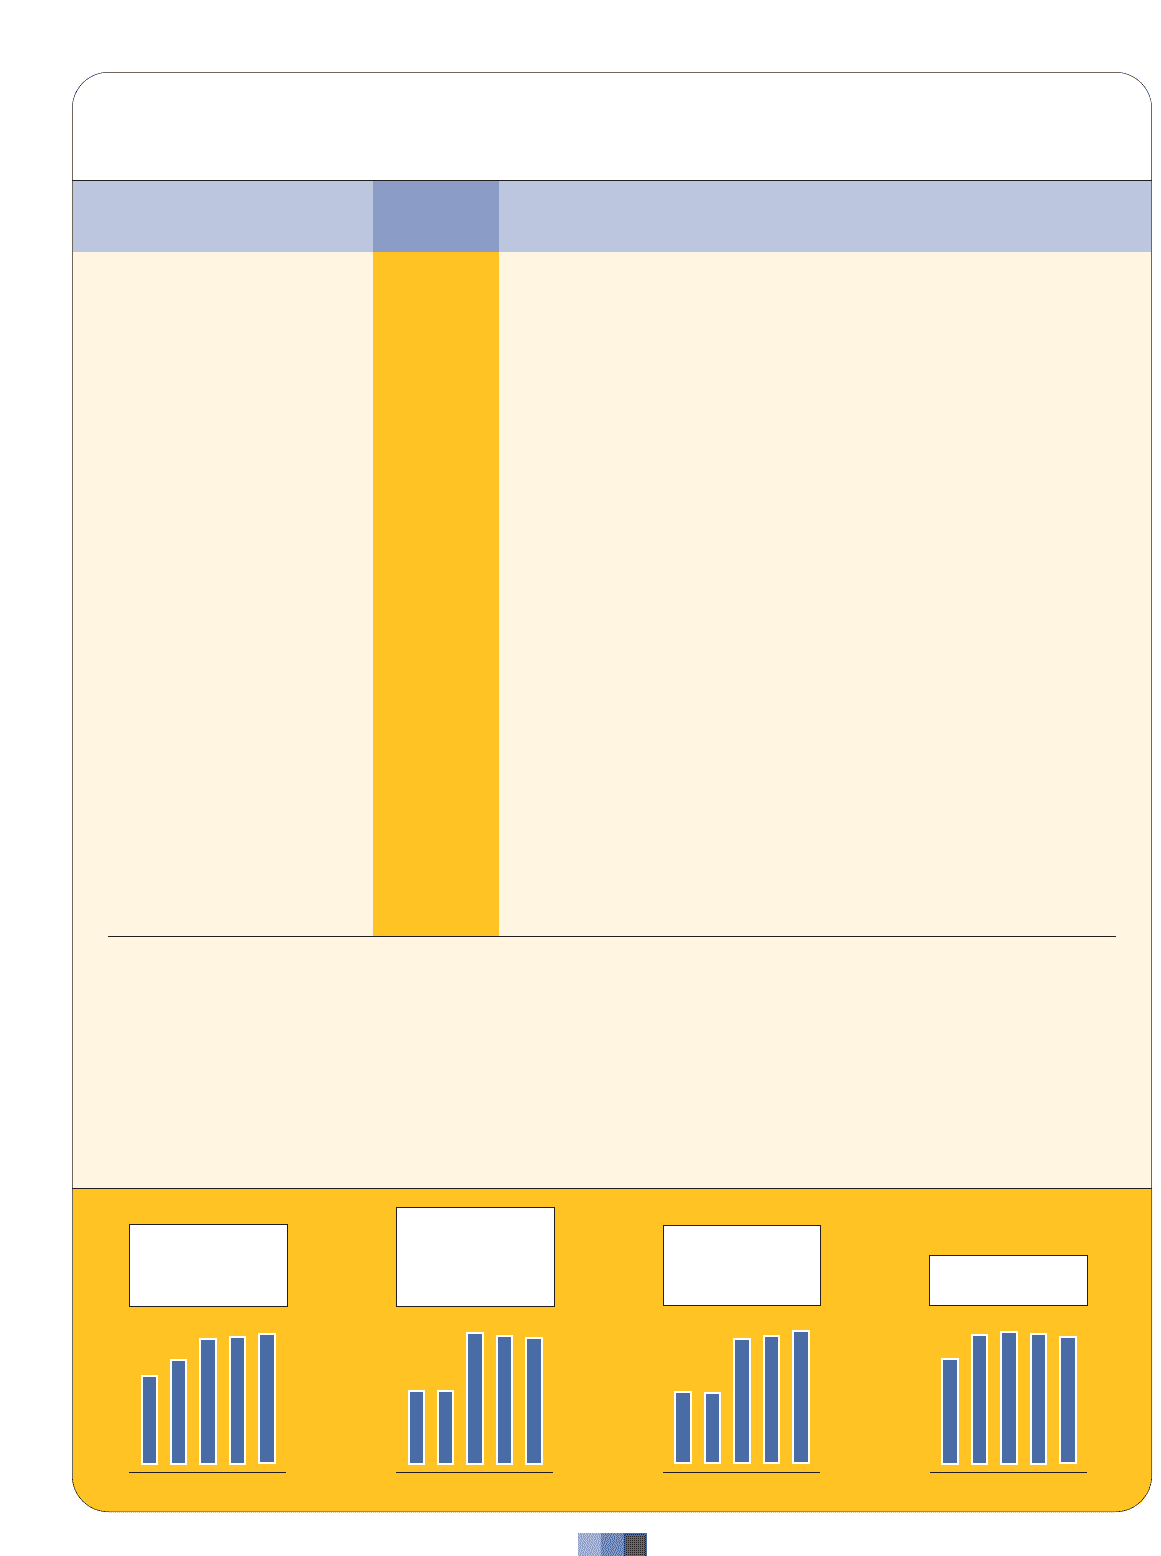
Financial Highlights
Dollars, except per share amounts,
and shares in thousands
01 02 03 04 05
1,680
1,972
2,368 2,407 2,479
Operating Revenues
from Continuing
Operations
(in millions)
01 02 03 04 05
195 194
345 337 334
Income
from Continuing
Operations, as
Adjusted
(in millions)
Diluted EPS
from Continuing
Operations, as
Adjusted
5-year
2005 2004 2003 2002 2001 CAGR(1)
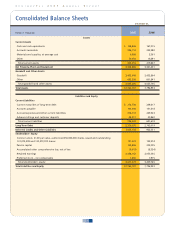
Operating revenues
from continuing operations $2,479,252 2,407,372 2,367,610 1,971,996 1,679,504 12.1%
Operating income
from continuing operations $ 736,403 753,953 750,396 575,406 425,305 13.8%
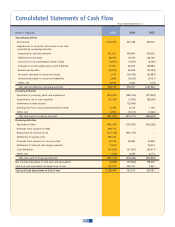
Depreciation
and amortization $ 531,931 500,904 503,652 450,197 440,404 8.6%
Income from continuing
operations, as adjusted(2) $ 334,479 337,244 344,707 193,533 195,408 15.3%
Net income $ 334,479 337,244 344,707 801,624 343,031 7.6%
Net income, as adjusted(2) $ 334,479 337,244 344,707 801,624 399,297 3.8%
Diluted earnings per share
from continuing operations,
as adjusted(2)(3) $ 2.49 2.41 2.35 1.35 1.37 16.5%
Diluted earnings per share,
as adjusted(2)(3) $ 2.49 2.41 2.35 5.56 2.81 4.9%
Dividends per common share $ 0.24 0.23 0.22 0.21 0.20 4.8%
Average diluted shares
outstanding 136,087 142,144 148,779 144,408 142,307 (0.8%)
Number of common
shareholders 4,482 4,720 4,613 5,181 5,460 (4.7%)
Total assets $7,762,707 7,796,953 7,895,852 7,770,408 6,318,684 4.0%
Long-term debt $2,376,070 2,762,019 3,109,302 3,578,132 2,087,500 (4.9%)
Stockholders’ equity $3,617,273 3,409,765 3,478,516 3,088,004 2,337,380 12.2%
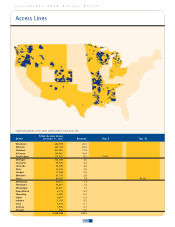
Telephone access lines 2,214,149 2,313,626 2,376,118 2,414,564 1,797,643 4.2%
DSL customers 248,706 142,575 83,465 52,858 25,485 115.4%
(1) Five-year compounded annual growth rate.
(2) As adjusted to reflect the effect of eliminating goodwill amortization in accordance with SFAS 142 for periods prior to 2002.
(3) Reflects the application of Emerging Issues Task Force No. 04-8 to all periods presented.
01 02 03 04 05
1.37 1.35
2.35 2.41 2.49
Total Assets
(in millions)
01 02 03 04 05
6,319
7,770 7,896 7,797 7,763