Cathay Pacific 2006 Annual Report Download - page 4
Download and view the complete annual report
Please find page 4 of the 2006 Cathay Pacific annual report below. You can navigate through the pages in the report by either clicking on the pages listed below, or by using the keyword search tool below to find specific information within the annual report.-
 1
1 -
 2
2 -
 3
3 -
 4
4 -
 5
5 -
 6
6 -
 7
7 -
 8
8 -
 9
9 -
 10
10 -
 11
11 -
 12
12 -
 13
13 -
 14
14 -
 15
15 -
16
-
17
-
18
-
19
-
20
-
21
-
22
-
23
-
24
-
25
-
26
-
27
-
28
-
29
-
30
-
31
-
32
-
33
-
34
-
35
-
36
-
37
-
38
-
39
-
40
-
41
-
42
-
43
-
44
-
45
-
46
-
47
-
48
-
49
-
50
-
51
-
52
-
53
-
54
-
55
-
56
-
57
-
58
-
59
-
60
-
61
-
62
-
63
-
64
-
65
-
66
-
67
-
68
-
69
-
70
-
71
-
72
-
73
-
74
-
75
-
76
-
77
-
78
-
79
-
80
-
81
-
82
-
83
-
84
-
85
-
86
-
87
-
88
-
89
-
90
-
91
-
92
-
93
-
94
-
95
-
96
-
97
-
98
-
99
-
100
 |
 |

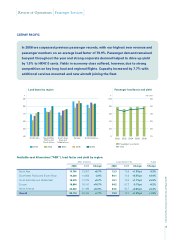
2006 2005 Change
GROUP FINANCIAL STATISTICS
Results
Turnover HK$ million 60,783 50,909 +19.4%
Profit attributable to Cathay Pacific shareholders HK$ million 4,088 3,298 +24.0%
Earnings per share HK cents 115.9 97.7 +18.6%
Dividend per share HK cents 84.0 48.0 +75.0%
Profit margin %8.0 7.4 +0.6%pt
Balance Sheet
Funds attributable to Cathay Pacific shareholders HK$ million 45,554 34,968 +30.3%
Net borrowings HK$ million 16,348 9,050 +80.6%
Shareholders’ funds per share HK$ 11.6 10.3 +12.6%
Net debt/equity ratio Times 0.36 0.26 +0.1 times
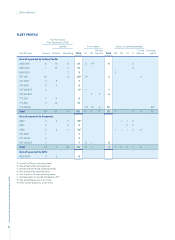
Cathay Pacific
and Dragonair* Cathay Pacific
2006 2006 2005 Change
OPERATING STATISTICS
Available tonne kilometres (“ATK”) Million 19,684 18,866 17,751 +6.3%
Passengers carried ‘000 18,097 16,728 15,438 +8.4%
Passenger load factor %79.5 79.9 78.7 +1.2%pt
Passenger yield HK cents 48.0 47.0 46.3 +1.5%
Cargo carried ‘000 tonnes 1,308 1,199 1,118 +7.2%
Cargo and mail load factor %68.6 68.3 67.0 +1.3%pt
Cargo and mail yield HK$ 1.70 1.69 1.75 -3.4%
Cost per ATK HK$ 2.23 2.21 2.19 +0.9%
Cost per ATK without fuel HK$ 1.57 1.53 1.55 -1.3%
Aircraft utilisation Hours per day 12.5 12.8 12.6 +1.6%
On-time performance %85.2 85.9 86.1 -0.2%pt
* Consolidated operating statistics includes Dragonair’s operation from 1st October 2006.
Cathay Pacific Airways Limited Annual Report 2006
2
Financial and Operating Highlights