Cathay Pacific 2006 Annual Report Download - page 21
Download and view the complete annual report
Please find page 21 of the 2006 Cathay Pacific annual report below. You can navigate through the pages in the report by either clicking on the pages listed below, or by using the keyword search tool below to find specific information within the annual report.-
 1
1 -
2
-
3
-
4
-
5
-
6
-
7
-
8
-
9
-
10
-
 11
11 -
 12
12 -
 13
13 -
 14
14 -
 15
15 -
 16
16 -
 17
17 -
 18
18 -
 19
19 -
 20
20 -
 21
21 -
 22
22 -
 23
23 -
 24
24 -
 25
25 -
 26
26 -
 27
27 -
 28
28 -
 29
29 -
 30
30 -
 31
31 -
32
-
33
-
34
-
35
-
36
-
37
-
38
-
39
-
40
-
41
-
42
-
43
-
44
-
45
-
46
-
47
-
48
-
49
-
50
-
51
-
52
-
53
-
54
-
55
-
56
-
57
-
58
-
59
-
60
-
61
-
62
-
63
-
64
-
65
-
66
-
67
-
68
-
69
-
70
-
71
-
72
-
73
-
74
-
75
-
76
-
77
-
78
-
79
-
80
-
81
-
82
-
83
-
84
-
85
-
86
-
87
-
88
-
89
-
90
-
91
-
92
-
93
-
94
-
95
-
96
-
97
-
98
-
99
-
100
 |
 |

2002 2003 2004 2005 2006
%
50
60
70
55
65
75
80
Cathay Pacific: revenue and
breakeven load factor
Revenue load factor
Breakeven load factor
Cathay Pacific
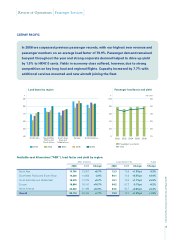
• Passenger turnover increased by 10.9% to
HK$33,585 million as a result of strong demand.
The number of passengers carried increased
by 8.4% to 16.7 million and revenue passenger
kilometres increased by 9.3%.
• Passenger load factor increased by 1.2 percentage
points to 79.9% while available seat kilometres
increased by 7.7%.
• Passenger yield increased by 1.5% to HK¢47.0.
• First and business class revenues increased by
16.0% and the front-end load factor increased from
66.0% to 67.5%. Economy class revenue increased
by 8.3% and the economy class load factor
increased from 80.9% to 82.1%.
• Cargo turnover rose by 3.4% to HK$11,980 million
with a 5.2% increase in capacity. Exports demand
from Mainland China through Hong Kong
remained strong.
• Cargo load factor increased by 1.3 percentage points
while cargo yield decreased by 3.4% to HK$1.69.
The improvement in traffic turnover comprises:
HK$M
+7.7% Passenger capacity 2,312
+5.2% Cargo and mail capacity 601
+1.2%pt Passenger load factor 476
+1.3%pt Cargo and mail load factor 240
+1.5% Passenger yield 523
-3.4% Cargo and mail yield (446)
3,706
• Revenue load factor increased by 1.4 percentage
points to 76.6% while the breakeven load factor
was 69.3%.
• The annualised revenue effect on changes in yield
and load factor is set out below:
HK$M
+ 1 percentage point in passenger
load factor
419
+ 1 percentage point in cargo and
mail load factor
175
+ HK¢1 in passenger yield 712
+ HK¢1 in cargo and mail yield 71
19
Cathay Pacific Airways Limited Annual Report 2006
Financial Review