Cathay Pacific 2006 Annual Report Download - page 11
Download and view the complete annual report
Please find page 11 of the 2006 Cathay Pacific annual report below. You can navigate through the pages in the report by either clicking on the pages listed below, or by using the keyword search tool below to find specific information within the annual report.-
 1
1 -
 2
2 -
 3
3 -
 4
4 -
 5
5 -
 6
6 -
 7
7 -
 8
8 -
 9
9 -
 10
10 -
 11
11 -
 12
12 -
 13
13 -
 14
14 -
 15
15 -
 16
16 -
 17
17 -
 18
18 -
 19
19 -
 20
20 -
 21
21 -
 22
22 -
23
-
24
-
25
-
26
-
27
-
28
-
29
-
30
-
31
-
32
-
33
-
34
-
35
-
36
-
37
-
38
-
39
-
40
-
41
-
42
-
43
-
44
-
45
-
46
-
47
-
48
-
49
-
50
-
51
-
52
-
53
-
54
-
55
-
56
-
57
-
58
-
59
-
60
-
61
-
62
-
63
-
64
-
65
-
66
-
67
-
68
-
69
-
70
-
71
-
72
-
73
-
74
-
75
-
76
-
77
-
78
-
79
-
80
-
81
-
82
-
83
-
84
-
85
-
86
-
87
-
88
-
89
-
90
-
91
-
92
-
93
-
94
-
95
-
96
-
97
-
98
-
99
-
100
 |
 |

%
40
50
60
70
80
90
2002 2003 2004 2005 2006
Load factor by region
North Asia South West
Pacific and
South Africa
South East
Asia and
Middle East
Europe North America
2002 2003 2004 2005 2006
%
0
40
20
60
100
80
10
20
30
40
50
60
Passenger load factor and yield
HK cents
Yield
Passenger load factor
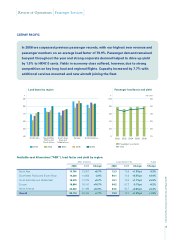
In 2006 we surpassed previous passenger records, with our highest ever revenue and
passenger numbers on an average load factor of 79.9%. Passenger demand remained
buoyant throughout the year and strong corporate demand helped to drive up yield
by 1.5% to HK47.0 cents. Yields in economy class suffered, however, due to strong
competition on key long haul and regional flights. Capacity increased by 7.7% with
additional services mounted and new aircraft joining the fleet.
Available seat kilometres (“ASK”), load factor and yield by region:
ASK (million) Load factor (%) Yield
2006 2005 Change 2006 2005 Change Change
North Asia 13,796 13,057 +5.7% 72.3 70.8 +1.5%pt -3.3%
South West Pacific and South Africa 14,230 14,656 -2.9% 80.1 74.6 +5.5%pt +2.0%
South East Asia and Middle East 18,375 17,376 +5.7% 76.1 75.0 +1.1%pt +5.0%
Europe 18,884 16,181 +16.7% 84.2 87.3 -3.1%pt -0.2%
North America 23,833 21,496 +10.9% 83.5 82.7 +0.8%pt +5.3%
Overall 89,118 82,766 +7.7% 79.9 78.7 +1.2%pt +1.5%
CATHAY PACIFIC
9
Cathay Pacific Airways Limited Annual Report 2006
Review of Operations Passenger Services