Cathay Pacific 2002 Annual Report Download - page 17
Download and view the complete annual report
Please find page 17 of the 2002 Cathay Pacific annual report below. You can navigate through the pages in the report by either clicking on the pages listed below, or by using the keyword search tool below to find specific information within the annual report.-
 1
1 -
2
-
3
-
4
-
5
-
6
-
 7
7 -
 8
8 -
 9
9 -
 10
10 -
 11
11 -
 12
12 -
 13
13 -
 14
14 -
 15
15 -
 16
16 -
 17
17 -
 18
18 -
 19
19 -
 20
20 -
 21
21 -
 22
22 -
 23
23 -
 24
24 -
 25
25 -
 26
26 -
 27
27 -
28
-
29
-
30
-
31
-
32
-
33
-
34
-
35
-
36
-
37
-
38
-
39
-
40
-
41
-
42
-
43
-
44
-
45
-
46
-
47
-
48
-
49
-
50
-
51
-
52
-
53
-
54
-
55
-
56
-
57
-
58
-
59
-
60
-
61
-
62
-
63
-
64
-
65
-
66
-
67
-
68
-
69
-
70
-
71
-
72
-
73
 |
 |

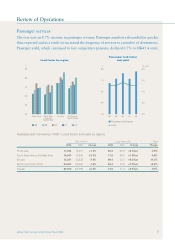
14 Cathay Pacific Airways Limited Annual Report 2002
Financial Review
•Cathay Pacific’s cargo turnover increased by
20.4% to HK$8,758 million. The improvement
reflects a recovery in exports from Hong Kong
and additional traffic following the integration
of AHK’s European operations in July 2002.
•Cathay Pacific’s cargo load factor rose by
3.9 percentage points to 71.2% whilst capacity
increased by 16.5%.
•Growth of Cathay Pacific’s turnover can be
analysed as follows:
HK$M
+0.4% Passenger capacity 85
+16.5% Cargo and mail capacity 1,201
+6.5%pt Passenger load factor 1,866
+3.9%pt Cargo and mail load factor 491
-0.7% Passenger yield (155)
-2.7% Cargo and mail yield (206)
3,282
•Revenue load factor increased by 5.5
percentage points to 75.9% whilst the
breakeven load factor reduced by 4.8
percentage points to 65.7%.
•The annualised revenue effect on changes in
yield and load factor are set out below:
HK$M
+1 percentage point in passenger
load factor 286
+1 percentage point in cargo and
mail load factor 123
+HK¢1 in passenger yield 490
+HK¢1 in cargo and mail yield 49
0201009998
50
55
60
65
70
75
80
0201009998
2,000
14,000
300
4,000 400
6,000 500
8,000 600
10,000 700
12,000 800
900
%
Cathay Pacific:
passengers and cargo carried
Passenger
in ’000
Cargo in
’000 tonnes
Passengers carried
Cargo carried
Revenue load factor
Breakeven load factor
Revenue and breakeven
load factor