Cathay Pacific 2002 Annual Report Download - page 10
Download and view the complete annual report
Please find page 10 of the 2002 Cathay Pacific annual report below. You can navigate through the pages in the report by either clicking on the pages listed below, or by using the keyword search tool below to find specific information within the annual report.-
 1
1 -
 2
2 -
 3
3 -
 4
4 -
 5
5 -
 6
6 -
 7
7 -
 8
8 -
 9
9 -
 10
10 -
 11
11 -
 12
12 -
 13
13 -
 14
14 -
 15
15 -
 16
16 -
 17
17 -
 18
18 -
 19
19 -
 20
20 -
 21
21 -
22
-
23
-
24
-
25
-
26
-
27
-
28
-
29
-
30
-
31
-
32
-
33
-
34
-
35
-
36
-
37
-
38
-
39
-
40
-
41
-
42
-
43
-
44
-
45
-
46
-
47
-
48
-
49
-
50
-
51
-
52
-
53
-
54
-
55
-
56
-
57
-
58
-
59
-
60
-
61
-
62
-
63
-
64
-
65
-
66
-
67
-
68
-
69
-
70
-
71
-
72
-
73
 |
 |

Cathay Pacific Airways Limited Annual Report 2002 7
Review of Operations
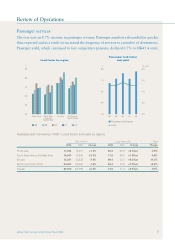
Passenger services
The year saw an 8.7% increase in passenger revenue. Passenger numbers rebounded far quicker
than expected and as a result we increased the frequency of services to a number of destinations.
Passenger yield, which continued to face competitive pressure, declined 0.7% to HK45.4 cents.
Available seat kilometres (“ASK”), load factor and yield by region:
ASK (million) Load factor (%) Yield
2002 2001 Change 2002 2001 Change Change
North Asia 11,022 10,279 +7.2% 69.2 68.8 +0.4%pt -4.9%
South East Asia and Middle East 14,063 13,609 +3.3% 71.8 64.0 +7.8%pt -4.6%
Europe 13,291 13,833 -3.9% 86.4 78.4 +8.0%pt +4.3%
Pacific and South Africa 24,674 25,069 -1.6% 80.4 72.5 +7.9%pt +2.6%
Overall 63,050 62,790 +0.4% 77.8 71.3 +6.5%pt -0.7%
0201009998
40
50
60
70
80
20
30
40
50
60
40
50
60
70
80
90
98 99 00 01 02
% %
Load factor by region
North Asia South East
Asia and
Middle East
Europe Pacific and
South Africa
Passenger load factor
and yield
HK cents
Passenger load factor
Yield