Cathay Pacific 2001 Annual Report Download - page 11
Download and view the complete annual report
Please find page 11 of the 2001 Cathay Pacific annual report below. You can navigate through the pages in the report by either clicking on the pages listed below, or by using the keyword search tool below to find specific information within the annual report.-
 1
1 -
 2
2 -
 3
3 -
 4
4 -
 5
5 -
 6
6 -
 7
7 -
 8
8 -
 9
9 -
 10
10 -
 11
11 -
 12
12 -
 13
13 -
 14
14 -
 15
15 -
 16
16 -
 17
17 -
 18
18 -
 19
19 -
 20
20 -
 21
21 -
 22
22 -
23
-
24
-
25
-
26
-
27
-
28
-
29
-
30
-
31
-
32
-
33
-
34
-
35
-
36
-
37
-
38
-
39
-
40
-
41
-
42
-
43
-
44
-
45
-
46
-
47
-
48
-
49
-
50
-
51
-
52
-
53
-
54
-
55
-
56
-
57
-
58
-
59
-
60
-
61
-
62
-
63
-
64
-
65
-
66
-
67
-
68
-
69
-
70
-
71
-
72
 |
 |

Cathay Pacific Airways Limited Annual Report 2001 9
SOUTH EAST ASIA AND
MIDDLE EAST
컄Most South East Asian markets were adversely
affected by the slowdown of the US economy.
This was partly offset by the greater propensity
to travel of overseas workers and Asian
emigrants visiting their home countries.
컄A new codeshare agreement was signed with
Philippine Airlines in November on the service
between Hong Kong and Cebu.
컄The Indian and Middle East markets performed
satisfactorily. The revenue picture was helped
by new services to Delhi and Riyadh, which
started during the year.
EUROPE
컄Load factors on European routes proved more
resilient in the face of the downturn than those
on any other routes. Yield declined, however,
due to the weakness of European currencies
against US dollar.
컄Our services to Zurich and Manchester were
suspended in the middle of the year. Services
to Istanbul were also temporarily suspended in
November.
PACIFIC AND
SOUTH AFRICA
컄Trans-Pacific traffic was badly affected by the
September incident, and a number of flights to
Los Angeles and Vancouver were suspended
as a result.
컄Australian and New Zealand markets performed
relatively well in terms of passenger numbers,
but yield was again under pressure due to the
weakness of local currencies.
컄Traffic to South Africa showed healthy growth,
despite currency weakness.
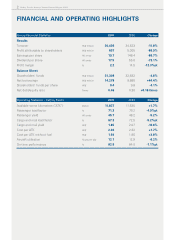
CARGO SERVICES
Turnover
0100999897
Cathay Pacific
AHK Air Hong Kong
HK$ million
0
2,000
4,000
6,000
8,000
10,000
12,000
Capacity – cargo and mail ATK
0100999897
Cathay Pacific
AHK Air Hong Kong
Million tonne
kilometres
1,000
0
2,000
3,000
4,000
5,000
6,000
7,000
ATK (million) Cargo and mail load factor (%) Yield
2001 2000 Change 2001 2000 Change Change
Cathay Pacific 5,855 5,740 +2.0% 67.3 72.5 -5.2%pt -10.6%
AHK Air Hong Kong 1,074 1,234 -13.0% 73.3 73.9 -0.6%pt -18.6%
REVIEW OF OPERATIONS