Cathay Pacific 2001 Annual Report Download - page 10
Download and view the complete annual report
Please find page 10 of the 2001 Cathay Pacific annual report below. You can navigate through the pages in the report by either clicking on the pages listed below, or by using the keyword search tool below to find specific information within the annual report.-
 1
1 -
 2
2 -
 3
3 -
 4
4 -
 5
5 -
 6
6 -
 7
7 -
 8
8 -
 9
9 -
 10
10 -
 11
11 -
 12
12 -
 13
13 -
 14
14 -
 15
15 -
 16
16 -
 17
17 -
 18
18 -
 19
19 -
 20
20 -
 21
21 -
22
-
23
-
24
-
25
-
26
-
27
-
28
-
29
-
30
-
31
-
32
-
33
-
34
-
35
-
36
-
37
-
38
-
39
-
40
-
41
-
42
-
43
-
44
-
45
-
46
-
47
-
48
-
49
-
50
-
51
-
52
-
53
-
54
-
55
-
56
-
57
-
58
-
59
-
60
-
61
-
62
-
63
-
64
-
65
-
66
-
67
-
68
-
69
-
70
-
71
-
72
 |
 |

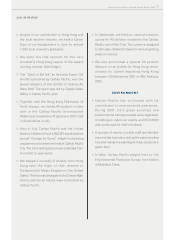
8Cathay Pacific Airways Limited Annual Report 2001
REVIEW OF OPERATIONS
Highlights by region are as follows:
NORTH ASIA
컄Traffic from Japan remained robust until the
events in September, which led to an increase
in passenger cancellations and a reduction in
passenger numbers.
컄The new service to Sapporo in northern Japan
PASSENGER SERVICES
The year saw a significant fall in passenger revenue as compared with 2000. This was due to
the worldwide economic slowdown, the impact of the tragic events in the United States on 11th
September, the decline in regional currencies and the industrial action initiated by the pilots’ union.
First Class and Business Class traffic fell by 14.1%.
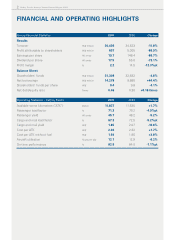
Available seat kilometres (“ASK”), load factor and yield by region:
ASK (million) Load factor (%) Yield
2001 2000 Change 2001 2000 Change Change
North Asia 10,279 9,912 +3.7% 68.8 74.1 -5.3%pt -4.1%
South East Asia and Middle East 13,609 12,097 +12.5% 64.0 72.6 -8.6%pt -9.1%
Europe 13,833 14,565 -5.0% 78.4 80.8 -2.4%pt -5.6%
Pacific and South Africa 25,069 25,335 -1.0% 72.5 76.0 -3.5%pt -4.8%
Overall 62,790 61,909 +1.4% 71.3 76.2 -4.9%pt -5.2%
commenced in December; initial revenue was
satisfactory.
컄The Korean market was stable throughout
the year.
컄Traffic from Taiwan dropped sharply due to the
country’s severe economic downturn.
Passengers originating from Hong Kong and
Mainland China helped sustain revenue on
this route.
0
20
40
60
80
100
%
Pacific and
South Africa
EuropeSouth East
Asia and
Middle East
North Asia
Load factor by region
97 98 99 00 01
0
20
40
60
80
0100999897
% HK cents
Passenger load factor
and yield
20
30
40
50
60
Passenger load factor
Yield