Cathay Pacific 1999 Annual Report Download - page 8
Download and view the complete annual report
Please find page 8 of the 1999 Cathay Pacific annual report below. You can navigate through the pages in the report by either clicking on the pages listed below, or by using the keyword search tool below to find specific information within the annual report.-
 1
1 -
 2
2 -
 3
3 -
 4
4 -
 5
5 -
 6
6 -
 7
7 -
 8
8 -
 9
9 -
 10
10 -
 11
11 -
 12
12 -
 13
13 -
 14
14 -
 15
15 -
 16
16 -
 17
17 -
 18
18 -
 19
19 -
20
-
21
-
22
-
23
-
24
-
25
-
26
-
27
-
28
-
29
-
30
-
31
-
32
-
33
-
34
-
35
-
36
-
37
-
38
-
39
-
40
-
41
-
42
-
43
-
44
-
45
-
46
-
47
-
48
-
49
-
50
-
51
-
52
-
53
-
54
-
55
-
56
-
57
-
58
-
59
-
60
-
61
-
62
-
63
-
64
-
65
 |
 |

12 CATHAY PACIFIC AIRWAYS LIMITED ANNUAL REPORT 1999
Review of Operations
Passenger Services
Despite signs that the worst may well be over for the Asian economies, 1999
proved to be another challenging year for passenger revenue, particularly in
our home-base, Hong Kong. Passenger numbers travelling in first and
business classes remained below pre-crisis levels. Economy class numbers
were helped by the continued increase in “sixth-freedom” traffic
(i.e. passengers transiting through Hong Kong). oneworld and codeshare
arrangements also helped our revenue growth.
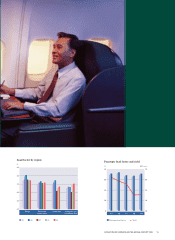
Available seat kilometres (“ASK”), load factor and yield:
ASK (million) Load Factor (%) Yield
1999 1998 Change 1999 1998 Change Change
Europe 13,905 13,927 -0.2% 74.5 74.3 +0.2%pt -5.2%
Pacific and South Africa 23,473 23,862 -1.6% 71.8 68.6 +3.2%pt +1.8%
North Asia 9,475 10,423 -9.1% 67.0 62.5 +4.5%pt +5.2%
South East Asia and Middle East 11,261 12,083 -6.8% 70.6 61.8 +8.8%pt -0.1%
Overall 58,114 60,295 -3.6% 71.4 67.5 +3.9%pt +0.4%