Cash America 2008 Annual Report Download - page 4
Download and view the complete annual report
Please find page 4 of the 2008 Cash America annual report below. You can navigate through the pages in the report by either clicking on the pages listed below, or by using the keyword search tool below to find specific information within the annual report.-
 1
1 -
 2
2 -
 3
3 -
 4
4 -
 5
5 -
 6
6 -
 7
7 -
 8
8 -
 9
9 -
 10
10 -
 11
11 -
 12
12 -
 13
13 -
 14
14 -
 15
15 -
16
-
17
-
18
-
19
-
20
-
21
-
22
-
23
-
24
-
25
-
26
-
27
-
28
-
29
-
30
-
31
-
32
-
33
-
34
-
35
-
36
-
37
-
38
-
39
-
40
-
41
-
42
-
43
-
44
-
45
-
46
-
47
-
48
-
49
-
50
-
51
-
52
-
53
-
54
-
55
-
56
-
57
-
58
-
59
-
60
-
61
-
62
-
63
-
64
-
65
-
66
-
67
-
68
-
69
-
70
-
71
-
72
-
73
-
74
-
75
-
76
-
77
-
78
-
79
-
80
-
81
-
82
-
83
-
84
-
85
-
86
-
87
-
88
-
89
-
90
-
91
-
92
-
93
-
94
-
95
-
96
-
97
-
98
-
99
-
100
-
101
-
102
-
103
-
104
-
105
-
106
-
107
-
108
-
109
-
110
-
111
-
112
-
113
-
114
-
115
-
116
-
117
-
118
-
119
-
120
-
121
-
122
-
123
-
124
-
125
-
126
-
127
-
128
-
129
-
130
-
131
-
132
-
133
-
134
-
135
-
136
-
137
-
138
-
139
-
140
-
141
-
142
-
143
-
144
 |
 |

1
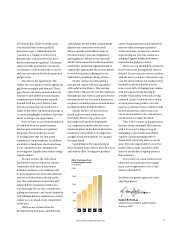
Financial Highlights
Total Revenue from
Continuing Operations
(in millions)
$1,200
$1,000
$800
$600
$400
$200
$0 04 05 06 07 08
$150
$120
$90
$60
$30
$0 04 05 06 07 08
Income from Operations
(in millions)
Earnings Per Share
from Continuing Operations
$3.00
$2.50
$2.00
$1.50
$1.00
$0.50
$0.0 04 05 06 07
08
$1,200
$1,000
$800
$600
$400
$200
$0
Total Assets
(in millions)
04
05
06
07 08
(Dollars in thousands, except per share data) 2008 2007 2006
OPERATIONS – years ended December 31
Total revenue $ 1,030,794 $ 929,394 $ 694,514
Income from operations before
depreciation and amortization 188,357 165,634 131,331
Income from operations 148,706 133,509 104,019
Net income (a) $ 81,140 $ 79,346 $ 60,940
Net income per share – Diluted $ 2.70 $ 2.61 $ 2.00
Dividends per share $ 0.14 $ 0.14 $ 0.10
BALANCE SHEETS – at December 31
Earning assets $ 362,090 $ 323,601 $ 294,419
Total assets 1,186,510 904,644 776,244
Total debt 438,154 288,777 219,749
Stockholders’ equity 575,041 496,602 440,728
Current ratio 3.1x 3.8x 3.2x
Debt to equity ratio 76.2% 58.2% 49.9%
Return on assets (b) 8.1% 9.8% 9.5%
Return on equity (b) 15.1% 17.0% 15.0%
Net book value per common share outstanding $ 19.51 $ 17.03 $ 14.83
Common shares outstanding (c) 29,475,706 29,156,020 29,728,465
(a) See “Management’s Discussion and Analysis of Financial Condition and Results of Operations” and “Financial Statements and Supplementary Data” for amounts related to the gain on
the sale of foreign notes in 2007 and the gain from the early termination of a lease contract in 2006.
(b) Returns based on Net income for the 12-month period divided by the monthly average of total assets and the monthly average of total equity of the Company.
(c) Includes 59,295 shares, 57,040 shares and 59,141 shares in 2008, 2007 and 2006, respectively, held in the Company’s Non-Qualied Savings Plan.
Cash America International, Inc.