Cash America 1999 Annual Report Download - page 9
Download and view the complete annual report
Please find page 9 of the 1999 Cash America annual report below. You can navigate through the pages in the report by either clicking on the pages listed below, or by using the keyword search tool below to find specific information within the annual report.-
 1
1 -
 2
2 -
 3
3 -
 4
4 -
 5
5 -
 6
6 -
 7
7 -
 8
8 -
 9
9 -
 10
10 -
 11
11 -
 12
12 -
 13
13 -
 14
14 -
 15
15
 |
 |

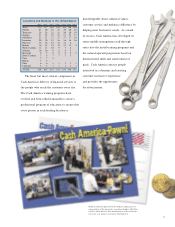
The final, but most critical, component in
Cash America’s delivery of financial services is
the people who reach the customer every day.
The Cash America training programs have
evolved and been refined annually to create a
professional program of education to ensure that
every person in each lending location is
7
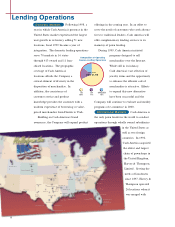
1999 1998 1997 1996 1995 1994 1993
Texas 179 177 144 145 145 146 146
Florida 61 60 58 51 49 40 28
Tennessee 28 28 22 21 20 20 19
Georgia 21 22 21 21 21 21 17
Oklahoma 21 21 17 17 17 17 16
Louisiana 20 20 19 16 16 16 16
Missouri 16 16 16 14 12 6
Indiana 16 14 14 14 14 13 4
North Carolina 11 11 10 9 7 4
Alabama 10 10 9 8 8 3
Kentucky 9 9 9 9 9 9 3
South Carolina 7 8 7 7 7 3
Utah 7 7 5
Illinois 7 5
Ohio 6 6 1 1 1 1 1
Colorado 5 5 1 1 1 1 1
TOTAL 424 419 353 334 327 300 251
knowledgeable about collateral values,
customer service and making a difference by
helping meet borrowers’ needs. As a mark
of success, Cash America has developed its
entire middle management staff through
entry into the initial training programs and
the natural upward progression based on
demonstrated skills and achievement of
goals. Cash America attracts people
interested in a dynamic and exciting
customer interactive experience
and provides the opportunity
for advancement.
Products and items depicted on this and preceding pages are
representative of the previously owned merchandise offered for
resale by Cash America. The manufacturers of these items do
not in any way sponsor or promote Cash America.
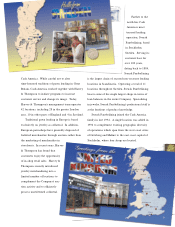
Locations and Markets in the United States