Carphone Warehouse 2005 Annual Report Download - page 15
Download and view the complete annual report
Please find page 15 of the 2005 Carphone Warehouse annual report below. You can navigate through the pages in the report by either clicking on the pages listed below, or by using the keyword search tool below to find specific information within the annual report.-
 1
1 -
2
-
3
-
4
-
 5
5 -
 6
6 -
 7
7 -
 8
8 -
 9
9 -
 10
10 -
 11
11 -
 12
12 -
 13
13 -
 14
14 -
 15
15 -
 16
16 -
 17
17 -
 18
18 -
 19
19 -
 20
20 -
 21
21 -
 22
22 -
 23
23 -
 24
24 -
 25
25 -
26
-
27
-
28
-
29
-
30
-
31
-
32
-
33
-
34
-
35
-
36
-
37
-
38
-
39
-
40
-
41
-
42
-
43
-
44
-
45
-
46
-
47
-
48
-
49
-
50
-
51
-
52
-
53
-
54
-
55
-
56
-
57
-
58
-
59
-
60
-
61
-
62
 |
 |

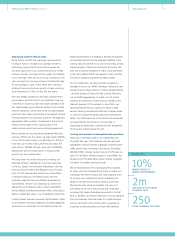
SALES PER SQUARE METRE
UP 7.3% (£)
’05
’04
’03
’02
10,200 11,676
14,30315,343
AVERAGE SPACE UP 14.3% (sqm)
’05
’04
’03
’02
60,800 63,233 66,170
75,619
way, and delivered 52 week connections growth of
40.4%. Our Spanish management team also succeeded
in opening 75 new stores during the period to take the
total to 239, and is confident of achieving further strong
growth in the portfolio over the coming year. The scale
of our Spanish operation is now feeding through
into material contributions, not only from a Retail
perspective, but also through Insurance and
Ongoing ARPU share income.
Our French Retail operations experienced more
challenging conditions as the market continued to
display subdued levels of network competition.
Nevertheless, connections were up 16.4%, which
represents a creditable performance in the market
context. We opened 9 new stores during the period,
taking the total French portfolio to 185. In the coming
year we are putting a renewed effort into expanding
our presence with a marked acceleration in new store
openings. In addition, we are confident that the market
environment will improve, with the entry of MVNOs
and closer regulatory involvement.
In our other major Retail markets, Sweden and The
Netherlands, we benefited from intense competition
between the network operators. The Swedish business
generated connections growth of 29.9% and opened
11 new stores, taking the base to 69 stores. Dutch
connections were up 11.2% and the portfolio increased
by 29 to 116 stores. 24 of these openings were
franchises, whose connections are excluded for
reporting purposes.
Connections growth across all our other markets,
incorporating Belgium, Germany, Ireland, Portugal
and Switzerland, was 29.8%. Our Belgian business
Total Retail revenues grew by 22.6% and gross profit
by 16.9%. Like-for-like, after stripping out the impact of
new store openings and the 53rd week, revenues grew
by 8.8% and gross profit by 5.0%. The increase in
revenues was driven both by the strong connections
growth through the year, and an increase in average
revenues per connection, which rose by 1.0% as
the average value of handsets increased.
Average cash gross profit per connection fell by 3.6%
from £56.0 to £54.0, in line with our expectations.
Subscription gross profit per connection held up very
well but the anticipated competition from other retailers
in the pre-pay market, where there are fewer barriers
to entry, saw pre-pay gross profit per connection fall.
Nonetheless, the significant uplift in volumes that we
experienced delivered a much higher level of overall
profitability from pre-pay connections than in the
previous year and the margin trend improved in the
second half, with gross profit per connection on both
subscription and pre-pay rising year-on-year.
Contribution (see note 10) to the financial statements
from Retail grew by 22.2% to £101.4m. The contribution
margin fell from 8.8% to 8.7%. However, the ratio
between contribution and gross profit, which gives a
more meaningful indication of cost efficiency given the
variability of revenues per connection, improved from
29.4% to 30.7%. Overall Retail direct costs grew by
14.7%, driven by the greater store base and like-for-like
growth in commission payments to our sales consultants
in the buoyant market. Within these figures, rent costs
increased by only 10.5%, as we benefited from a wider
geographic spread.
In the UK, our store portfolio increased from 509 stores
to 601 stores. We have continued our strategy of
identifying sites on arterial routes and in retail parks, but
at the same time we have had great success in opening
stores in smaller towns. This new type of location will
provide us with ample opportunities to continue to grow
our UK portfolio over the medium term, and we are
targeting a further 100 openings in the next 12 months.
Our businesses outside the UK continued to deliver
very encouraging growth. Once again, Spain led the
Operating and Financial Review continued www.cpwplc.com 11
LIKE FOR LIKE GROSS
PROFIT UP 5.0%
RETAIL CONTRIBUTION
UP 22.2%
5YEAR SUBSCRIPTIONS
GROWTH OF 20.3%
Connections (000s)
52 weeks 52 weeks 53 weeks
to to to
26 March 27 March 2 April
2005 2004 2005
Subscription 2,770 2,413 2,816
Pre-pay 3,227 2,520 3,272
SIM-free 506 417 512
Group 6,503 5,350 6,600