Carnival Cruises 2014 Annual Report Download - page 3
Download and view the complete annual report
Please find page 3 of the 2014 Carnival Cruises annual report below. You can navigate through the pages in the report by either clicking on the pages listed below, or by using the keyword search tool below to find specific information within the annual report.-
 1
1 -
 2
2 -
 3
3 -
 4
4 -
 5
5 -
 6
6 -
 7
7 -
 8
8 -
 9
9 -
 10
10 -
 11
11 -
 12
12 -
 13
13 -
 14
14 -
15
-
16
-
17
-
18
-
19
-
20
-
21
-
22
-
23
-
24
-
25
-
26
-
27
-
28
-
29
-
30
-
31
-
32
-
33
-
34
-
35
-
36
-
37
-
38
-
39
-
40
-
41
-
42
-
43
-
44
-
45
-
46
-
47
-
48
-
49
-
50
-
51
-
52
-
53
-
54
-
55
-
56
-
57
-
58
-
59
-
60
-
61
-
62
-
63
-
64
-
65
-
66
-
67
-
68
-
69
-
70
-
71
-
72
-
73
-
74
-
75
-
76
-
77
-
78
-
79
-
80
 |
 |

COMPANY
Carnival Corporation & plc is among the most profitable and financially strong leisure travel companies in the
world. We are the largest cruise company with a global market share of 48% based on the number of guests
carried and a leading provider of vacations to all major cruise destinations throughout the world. We operate our
cruise ships within a portfolio of nine leading global, regional and national cruise brands that sell tailored cruise
products, services and vacation experiences in all the world’s most important vacation markets. We believe
having global and regional brands that are predominately serving multiple source markets and national brands
that are predominately serving major source markets provides us with a unique advantage to compete within the
entire leisure market for consumers’ discretionary vacation spending. Our vision is to deliver unmatched joyful
vacation experiences and breakthrough total shareholder returns by exceeding guest expectations and achieving
the full benefits inherent in our scale.
Our portfolio of cruise brands in North America, Europe, Australia and Asia are comprised of Carnival Cruise
Line, Holland America Line, Princess Cruises, Seabourn, AIDA Cruises, Costa Cruises, Cunard, P&O Cruises
(Australia) and P&O Cruises (UK). Together, these brands operate 100 ships totaling 212,000 lower berths with
ten new ships scheduled to enter service between late February 2015 and November 2018. Carnival Corporation
& plc also operates Holland America Princess Alaska Tours, the leading tour company in Alaska and the
Canadian Yukon, which complements our Alaska cruise operations. Traded on both the New York and London
Stock Exchanges, Carnival Corporation & plc is the only group in the world to be included in both the S&P 500
and the FTSE 100 indices.
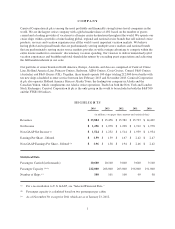
HIGHLIGHTS
2014 2013 2012 2011 2010
(in millions, except per share amounts and statistical data)
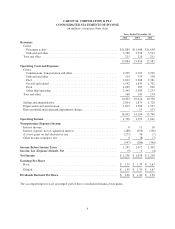
Revenues $ 15,884 $ 15,456 $ 15,382 $ 15,793 $ 14,469
Net Income $ 1,236 $ 1,078 $ 1,298 $ 1,912 $ 1,978
Non-GAAP Net Income (a) $ 1,524 $ 1,232 $ 1,514 $ 1,939 $ 1,934
Earnings Per Share - Diluted $ 1.59 $ 1.39 $ 1.67 $ 2.42 $ 2.47
Non-GAAP Earnings Per Share - Diluted (a) $ 1.96 $ 1.58 $ 1.94 $ 2.46 $ 2.42
Statistical Data
Passengers Carried (in thousands) 10,600 10,100 9,800 9,600 9,100
Passenger Capacity (b) (c) 212,000 208,000 203,000 196,000 191,000
Number of Ships (c) 100 101 100 99 98
(a) For a reconciliation to U.S. GAAP, see “Selected Financial Data.”
(b) Passenger capacity is calculated based on two passengers per cabin.
(c) As of November 30, except for 2011 which are as of January 23, 2012.
1