Carnival Cruises 2014 Annual Report Download - page 11
Download and view the complete annual report
Please find page 11 of the 2014 Carnival Cruises annual report below. You can navigate through the pages in the report by either clicking on the pages listed below, or by using the keyword search tool below to find specific information within the annual report.-
 1
1 -
 2
2 -
 3
3 -
 4
4 -
 5
5 -
 6
6 -
 7
7 -
 8
8 -
 9
9 -
 10
10 -
 11
11 -
 12
12 -
 13
13 -
 14
14 -
 15
15 -
 16
16 -
 17
17 -
 18
18 -
 19
19 -
 20
20 -
 21
21 -
 22
22 -
23
-
24
-
25
-
26
-
27
-
28
-
29
-
30
-
31
-
32
-
33
-
34
-
35
-
36
-
37
-
38
-
39
-
40
-
41
-
42
-
43
-
44
-
45
-
46
-
47
-
48
-
49
-
50
-
51
-
52
-
53
-
54
-
55
-
56
-
57
-
58
-
59
-
60
-
61
-
62
-
63
-
64
-
65
-
66
-
67
-
68
-
69
-
70
-
71
-
72
-
73
-
74
-
75
-
76
-
77
-
78
-
79
-
80
 |
 |

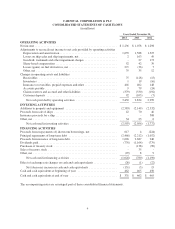
CARNIVAL CORPORATION & PLC
CONSOLIDATED STATEMENTS OF CASH FLOWS
(in millions)
Years Ended November 30,
2014 2013 2012
OPERATING ACTIVITIES
Net income ........................................................ $1,236 $ 1,078 $ 1,298
Adjustments to reconcile net income to net cash provided by operating activities
Depreciation and amortization ....................................... 1,635 1,588 1,527
Losses on ship sales and ship impairments, net .......................... 2 163 49
Goodwill, trademark and other impairment charges ...................... - 27 173
Share-based compensation .......................................... 52 42 39
Losses (gains) on fuel derivatives, net ................................. 271 (36) 7
Other, net ....................................................... 35 35 12
Changes in operating assets and liabilities
Receivables ..................................................... 75 (128) (15)
Inventories ...................................................... 1 19 (16)
Insurance recoverables, prepaid expenses and other ...................... 401 402 148
Accounts payable ................................................. 9 79 (24)
Claims reserves and accrued and other liabilities ........................ (379) (330) (192)
Customer deposits ................................................ 92 (105) (7)
Net cash provided by operating activities ............................ 3,430 2,834 2,999
INVESTING ACTIVITIES
Additions to property and equipment ................................... (2,583) (2,149) (2,332)
Proceeds from sale of ships ........................................... 42 70 46
Insurance proceeds for a ship .......................................... - - 508
Other, net ......................................................... 34 23 6
Net cash used in investing activities ................................ (2,507) (2,056) (1,772)
FINANCING ACTIVITIES
Proceeds from (repayments of) short-term borrowings, net .................. 617 4 (224)
Principal repayments of long-term debt ................................. (2,466) (2,212) (1,052)
Proceeds from issuance of long-term debt ................................ 1,626 2,687 946
Dividends paid ..................................................... (776) (1,164) (779)
Purchases of treasury stock ........................................... - (138) (90)
Sales of treasury stock ............................................... - 35 -
Other, net ......................................................... (29) 8 9
Net cash used in financing activities ................................ (1,028) (780) (1,190)
Effect of exchange rate changes on cash and cash equivalents ................ (26) (1) (22)
Net (decrease) increase in cash and cash equivalents ................... (131) (3) 15
Cash and cash equivalents at beginning of year ........................... 462 465 450
Cash and cash equivalents at end of year ................................ $ 331 $ 462 $ 465
The accompanying notes are an integral part of these consolidated financial statements.
9