Carnival Cruises 2011 Annual Report Download - page 2
Download and view the complete annual report
Please find page 2 of the 2011 Carnival Cruises annual report below. You can navigate through the pages in the report by either clicking on the pages listed below, or by using the keyword search tool below to find specific information within the annual report.-
 1
1 -
 2
2 -
 3
3 -
 4
4 -
 5
5 -
 6
6 -
 7
7 -
 8
8 -
 9
9 -
 10
10 -
 11
11 -
 12
12 -
 13
13 -
14
-
15
-
16
-
17
-
18
-
19
-
20
-
21
-
22
-
23
-
24
-
25
-
26
-
27
-
28
-
29
-
30
-
31
-
32
-
33
-
34
-
35
-
36
-
37
-
38
-
39
-
40
-
41
-
42
-
43
-
44
-
45
-
46
-
47
-
48
-
49
-
50
-
51
-
52
-
53
-
54
-
55
-
56
-
57
-
58
-
59
-
60
-
61
-
62
-
63
-
64
 |
 |

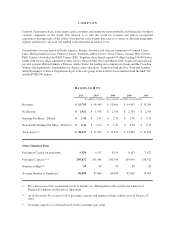
COMPANY
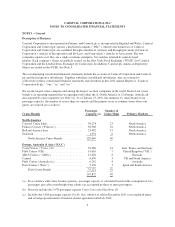
Carnival Corporation & plc is the largest cruise company and among the most profitable and financially strongest
vacation companies in the world. Our mission is to take the world on vacation and deliver exceptional
experiences through many of the world’s best-known cruise brands that cater to a variety of different geographic
regions and lifestyles, all at an outstanding value unrivaled on land or at sea.
Our portfolio of cruise brands in North America, Europe, Australia and Asia are comprised of Carnival Cruise
Lines, Holland America Line, Princess Cruises, Seabourn, AIDA Cruises, Costa Cruises, Cunard, Ibero Cruises,
P&O Cruises (Australia) and P&O Cruises (UK). Together, these brands operate 99 ships totaling 196,000 lower
berths with 10 new ships scheduled to enter service between May 2012 and March 2016. Carnival Corporation &
plc also operates Holland America Princess Alaska Tours, the leading tour company in Alaska and the Canadian
Yukon, which primarily complements our Alaska cruise operations. Traded on both the New York and London
Stock Exchanges, Carnival Corporation & plc is the only group in the world to be included in both the S&P 500
and the FTSE 100 indices.
HIGHLIGHTS
2011 2010 2009 2008 2007
(in millions, except per share amounts and other statistical data)
Revenues $ 15,793 $ 14,469 $ 13,460 $ 14,947 $ 13,306
Net Income $ 1,912 $ 1,978 $ 1,790 $ 2,324 $ 2,395
Earnings Per Share - Diluted $ 2.42 $ 2.47 $ 2.24 $ 2.90 $ 2.95
Non-GAAP Earnings Per Share - Diluted (a) $ 2.42 $ 2.47 $ 2.24 $ 2.90 $ 2.95
Total Assets (b) $ 38,637 $ 37,490 $ 36,835 $ 33,400 $ 34,181
Other Statistical Data
Passengers Carried (in thousands) 9,559 9,147 8,519 8,183 7,672
Passenger Capacity (b) (c) 195,872 191,464 180,746 169,040 158,352
Number of Ships (b) 99 98 93 88 85
Average Number of Employees 90,000 87,000 84,000 82,000 78,000
(a) For a discussion of the reconciliation to U.S. GAAP, see “Management’s Discussion and Analysis of
Financial Condition and Results of Operations.”
(b) As of November 30, except for 2011 passenger capacity and number of ships, which are as of January 23,
2012.
(c) Passenger capacity is calculated based on two passengers per cabin.