Carnival Cruises 2011 Annual Report Download
Download and view the complete annual report
Please find the complete 2011 Carnival Cruises annual report below. You can navigate through the pages in the report by either clicking on the pages listed below, or by using the keyword search tool below to find specific information within the annual report.-
 1
1 -
 2
2 -
 3
3 -
 4
4 -
 5
5 -
 6
6 -
 7
7 -
 8
8 -
 9
9 -
 10
10 -
 11
11 -
 12
12 -
13
-
14
-
15
-
16
-
17
-
18
-
19
-
20
-
21
-
22
-
23
-
24
-
25
-
26
-
27
-
28
-
29
-
30
-
31
-
32
-
33
-
34
-
35
-
36
-
37
-
38
-
39
-
40
-
41
-
42
-
43
-
44
-
45
-
46
-
47
-
48
-
49
-
50
-
51
-
52
-
53
-
54
-
55
-
56
-
57
-
58
-
59
-
60
-
61
-
62
-
63
-
64
 |
 |

2011 ANNUAL REPORT
Table of contents
-
Page 1
2011 ANNUAL REPORT -
Page 2
... of different geographic regions and lifestyles, all at an outstanding value unrivaled on land or at sea. Our portfolio of cruise brands in North America, Europe, Australia and Asia are comprised of Carnival Cruise Lines, Holland America Line, Princess Cruises, Seabourn, AIDA Cruises, Costa Cruises... -
Page 3
... constant dollars). Carnival Corporation & plc remained among the world's most profitable leisure travel companies in 2011, posting net income of $1.9 billion or $2.42 per share. Our North American brands performed well, achieving an almost four percent revenue yield increase, continuing to benefit... -
Page 4
... and identify improvement opportunities. The information in these reports better equips us to address sustainability challenges and advance as a global company. Thanks and Recognition I would like to take this opportunity to thank all of our shareholders, as well as our valued 90,000 employees both... -
Page 5
... shareholder proxy card, shares certificate or a current brokerage or nominee statement) to your travel agent or to the cruise line you have selected below. NORTH AMERICA BRANDS CONTINENTAL EUROPE BRANDS UNITED KINGDOM BRANDS CARNIVAL CRUISE LINES Guest Administration 3655 N.W. 87th Avenue Miami, FL... -
Page 6
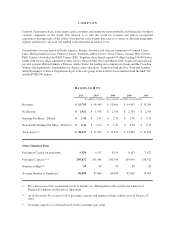
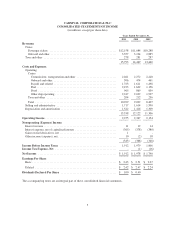
CARNIVAL CORPORATION & PLC CONSOLIDATED STATEMENTS OF INCOME (in millions, except per share data) Years Ended November 30, 2011 2010 2009 Revenues Cruise Passenger tickets ...Onboard and other ...Tour and other ...Costs and Expenses Operating Cruise Commissions, transportation and other ...Onboard ... -
Page 7
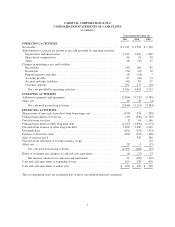
...Customer deposits ...Total current liabilities ...Long-Term Debt ...Other Long-Term Liabilities and Deferred Income ...Commitments and Contingencies Shareholders' Equity Common stock of Carnival Corporation, $0.01 par value; 1,960 shares authorized; 647 shares at 2011 and 646 shares at 2010 issued... -
Page 8
CARNIVAL CORPORATION & PLC CONSOLIDATED STATEMENTS OF CASH FLOWS (in millions) Years Ended November 30, 2011 2010 2009 OPERATING ACTIVITIES Net income ...Adjustments to reconcile net income to net cash provided by operating activities Depreciation and amortization ...Share-based compensation ...... -
Page 9
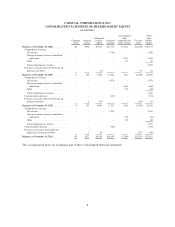
... declared ...Purchases of treasury stock under the Repurchase Program and other ...Balances at November 30, 2011 ...$6 - Ordinary shares $354 - Retained earnings $13,771 1,790 - Treasury stock $(2,296) - The accompanying notes are an integral part of these consolidated financial statements. 8 -
Page 10
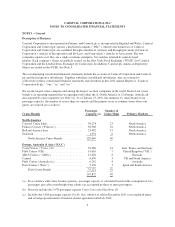
... 23, 2012, the summary by cruise brand of our passenger capacity, the number of cruise ships we operate and the primary areas or countries from where our guests are sourced are as follows: Cruise Brands North America Carnival Cruise Lines ...Princess Cruises ("Princess") ...Holland America Line... -
Page 11
... at cost. At November 30, 2011 and 2010, cash and cash equivalents are comprised of cash on hand, money market funds and time deposits. Inventories Inventories consist primarily of food and beverage provisions, hotel and restaurant products and supplies, fuel and gift shop and art merchandise held... -
Page 12
.... Future travel discount vouchers issued to guests are recorded as a reduction of cruise passenger ticket revenues when such vouchers are utilized. Cancellation fees are recognized in cruise passenger ticket revenues at the time of the cancellation. Our sale to guests of air and other transportation... -
Page 13
... 2011, 2010 and 2009, respectively. The remaining portion of governmental fees and taxes are also included in passenger ticket revenues but are expensed in other ship operating expenses. Revenues and expenses from our hotel, tour and transportation operations are recognized at the time the services... -
Page 14
... the "if converted" method of accounting from the date of issuance. Share-Based Compensation We recognize compensation expense for all share-based compensation awards using the fair value method. Share-based compensation cost is recognized ratably using the straight-line attribution method over the... -
Page 15
... financial statements for both Carnival Corporation and Carnival plc have not been presented. NOTE 4 - Property and Equipment Property and equipment consisted of the following (in millions): November 30, 2011 2010 Ships, including ship improvements ...Ships under construction ...Land, buildings... -
Page 16
..., including minor improvement costs and dry-dock expenses, were $830 million, $797 million and $749 million in fiscal 2011, 2010 and 2009, respectively, and are substantially all included in other ship operating expenses. In 2010, we recognized a $44 million gain on the sale of P&O Cruises (UK... -
Page 17
... 2016 ...Euro fixed rate, bearing interest at 6.7% to 7.3%, due through 2018 (b) ...Publicly-Traded Notes Fixed rate, bearing interest at 6.7% to 7.2%, due through 2028 ...Euro fixed rate, bearing interest at 4.3%, due in 2013 ...Sterling fixed rate, bearing interest at 5.6%, due in 2012 ...Other... -
Page 18
...which were used to pay for a portion of Carnival Magic's purchase price. This facility bears interest at LIBOR plus a margin of 160 basis points ("bps") and is due in semi-annual installments through April 2023. (d) In 2011, we repaid $300 million of an unsecured floating rate export credit facility... -
Page 19
...Funding Cruise Brands and Ships North America Carnival Cruise Lines Carnival Breeze ...Princess Royal Princess ...Newbuild ...North America Cruise Brands ...EAA AIDA AIDAmar Newbuild Newbuild Newbuild Amount (in millions) 2012 2013 2014 $ 560 538 538 1,636 ... 2012 2013 2015 2016 2015 2014 389... -
Page 20
... estimated total costs in fiscal 2012, 2013, 2014, 2015 and 2016, respectively. Operating Leases, Port Facilities and Other Commitments Rent expense under our operating leases, primarily for office and warehouse space, was $59 million, $61 million and $54 million in fiscal 2011, 2010 and 2009... -
Page 21
... under Section 883 list items that the Internal Revenue Service does not consider to be incidental to ship operations. Among the items identified as not incidental is income from the sale of air transportation, transfers, shore excursions and pre- and post-cruise land and tour packages to the extent... -
Page 22
... Cruises (Australia)'s income is exempt from Australian corporation taxes by virtue of the UK/Australian income tax treaty. Italian, German, Portuguese and Spanish Income Tax Carnival plc's German and Spanish brands, AIDA and Ibero, are both divisions of Costa. Effective through fiscal 2014, Costa... -
Page 23
... these taxes and/or fees are included in other ship operating expenses. NOTE 9 - Shareholders' Equity Carnival Corporation's Articles of Incorporation authorize its Board of Directors, at its discretion, to issue up to 40 million shares of preferred stock. At November 30, 2011 and 2010, no Carnival... -
Page 24
... shares of Carnival Corporation common stock reserved for issuance under its employee benefit and dividend reinvestment plans. In addition, Carnival plc shareholders have authorized 17.8 million ordinary shares for future issuance under its employee benefit plans. At November 30, 2011 and 2010... -
Page 25
... 30, 2011 and 2010 being higher than the floating interest rates on these debt obligations, including the impact of changes in our credit ratings, if any. The fair values of our publicly-traded notes were based on their unadjusted quoted market prices in active markets. The fair values of our... -
Page 26
...July 2017. (f) We have both U.S. dollar and sterling interest rate swaps designated as fair value hedges whereby we receive fixed interest rate payments in exchange for making floating interest rate payments. At November 30, 2011 and 2010, these interest rate swap agreements effectively changed $510... -
Page 27
... fair values based upon a discounted future cash flow analysis, which estimated the amount of royalties that we are relieved from having to pay for use of the associated trademarks, based upon forecasted cruise revenues and royalty rates that a market participant would use. The royalty rates are... -
Page 28
..., as well as our risk management objectives and strategies for undertaking the hedge transactions. We classify the fair values of all our derivative contracts and the fair values of our hedged firm commitments as either current or long-term depending on whether the maturity date of the derivative... -
Page 29
... dollar. Any weakening of the U.S. dollar against these foreign currencies has the financial statement effect of increasing the U.S. dollar values reported for cruise revenues and expenses. Strengthening of the U.S. dollar has the opposite effect. Most of our brands have non-functional currency risk... -
Page 30
... affect our desire to order future new cruise ships for U.S. dollar or sterling functional currency brands. Interest Rate Risks We manage our exposure to fluctuations in interest rates through our investment and debt portfolio management strategies. These strategies include purchasing high quality... -
Page 31
...credit sales. NOTE 11 - Segment Information We have three reportable cruise segments that are comprised of our (1) North America cruise brands, (2) EAA cruise brands and (3) Cruise Support. In addition, we have a Tour and Other segment. Our North America cruise segment includes Carnival Cruise Lines... -
Page 32
... principally of our ships and ships under construction. Revenues by geographic areas, which are based on where our guests are sourced and not the cruise brands on which they sailed, were as follows (in millions): Years Ended November 30, 2011 2010 2009 North America ...Europe ...Australia and Asia... -
Page 33
...cruise payroll and related expenses in fiscal 2011, 2010 and 2009, respectively. Stock Option Plans The Committee generally set stock option exercise prices at 100% or more of the fair market value of the underlying common stock/ordinary shares on the date the option was granted. Generally, employee... -
Page 34
...of our plans' benefit obligations at November 30, 2011 and 2010, we assumed weighted-average discount rates of 4.5% and 5.0%, respectively. The net asset or net liability positions under these single-employer defined benefit pension plans are not material. In addition, P&O Cruises (UK), Princess and... -
Page 35
... to most of our employees. We contribute to these plans based on employee contributions, salary levels and length of service. Total expense for these plans was $21 million, $20 million and $16 million in fiscal 2011, 2010 and 2009, respectively. NOTE 13 - Earnings Per Share Our basic and diluted... -
Page 36
... is included in this 2011 Annual Report. Micky Arison Chairman of the Board and Chief Executive Officer January 30, 2012 Howard S. Frank Vice Chairman of the Board and Chief Operating Officer January 30, 2012 David Bernstein Senior Vice President and Chief Financial Officer January 30, 2012 35 -
Page 37
... of the Public Company Accounting Oversight Board (United States). Those standards require that we plan and perform the audits to obtain reasonable assurance about whether the financial statements are free of material misstatement and whether effective internal control over financial reporting was... -
Page 38
...; increases to our repairs and maintenance expenses and refurbishment costs as our fleet ages; lack of continuing availability of attractive, convenient and safe port destinations; continuing financial viability of our travel agent distribution system, air service providers and other key vendors... -
Page 39
... increase in ALBDs, which accounted for $121 million, and a weaker U.S. dollar compared to other currencies, which accounted for $113 million. As always, we worked diligently throughout 2011 to improve our cost structure benefitting from our ongoing cost containment programs and leveraging our size... -
Page 40
... include the scheduled withdrawal from service of P&O Cruises (Australia's) Pacific Sun in July 2012 and withdrawal from service of Costa Concordia for all years (see "Note 15 - Subsequent Events" in the accompanying consolidated financial statements), but exclude any unannounced future ship orders... -
Page 41
... statements involve risks, uncertainties and assumptions with respect to us. There are many factors that could cause our actual results to differ materially from those expressed above including, but not limited to, general economic and business conditions, increases in fuel prices, ship incidents... -
Page 42
... for every year we reduce our estimated average 30 year ship useful life. In addition, if our ships were estimated to have no residual value, our 2011 depreciation expense would increase by approximately $190 million. We believe that the estimates we made for ship accounting purposes are reasonable... -
Page 43
... future operating results, including net revenue yields, net cruise costs including fuel prices, capacity changes, including the expected deployment of vessels into, or out of, the cruise brand, weighted-average cost of capital for comparable publicly-traded companies, terminal values, cruise... -
Page 44
...costs that are directly associated with passenger cruise ticket revenues, and include travel agent commissions, air and other transportation related costs, governmental fees and taxes that vary with guest head counts and related credit card fees, onboard and other cruise costs, which represent costs... -
Page 45
... dollar, which accounted for $58 million. Onboard and other revenues included concession revenues of $1.1 billion in 2011 and $958 million in 2010. North America Brands Approximately 76% of 2011 total revenues are comprised of cruise passenger ticket revenues. Cruise passenger ticket revenues... -
Page 46
... addition of new ships, and a weaker U.S. dollar against the euro, sterling and Australia dollar, which accounted for $26 million. Our total costs and expenses as a percentage of revenues increased to 85.7% in 2011 from 83.8% in 2010. North America Brands Operating costs and expenses increased $554... -
Page 47
..., which are travel agent commissions, cost of air and other transportation, certain other costs that are directly associated with onboard and other revenues and credit card fees. Substantially all of our remaining cruise costs are largely fixed, except for the impact of changing prices, once our... -
Page 48
... report these non-GAAP financial measures assuming the 2011 and 2010 periods' currency exchange rates have remained constant with the 2010 and 2009 periods' rates, respectively, or on a "constant dollar basis," in order to remove the impact of changes in exchange rates on our non-U.S. dollar cruise... -
Page 49
..., 2011 2010 Constant Constant Dollar 2010 Dollar 2011 2009 Cruise operating expenses ...Cruise selling and administrative expenses ...Gross cruise costs ...Less cruise costs included in net cruise revenues Commissions, transportation and other ...Onboard and other ...Net cruise costs ...Less fuel... -
Page 50
... on crew travel, food, freight and other hotel operating expenses. Fuel costs increased $571 million, or 35.2%, to $2.2 billion in 2011 from $1.6 billion in 2010. This was caused by higher fuel prices, which accounted for $535 million, and a 5.1% capacity increase in ALBDs, which accounted for $83... -
Page 51
.... Our 2010 cruise passenger ticket revenue increase was partially offset by the impacts of lower air transportation revenues due to fewer guests purchasing their air travel through us, and a stronger U.S. dollar against the euro and sterling compared to 2009 (see "Key Performance Non-GAAP Financial... -
Page 52
..., which accounted for $167 million. These increases were partially offset by the benefits from cost reduction programs and economies of scale and lower air transportation costs due to fewer guests purchasing air travel through us. Selling and administrative expenses of $902 million were flat in 2010... -
Page 53
...EAA brand yields that were primarily caused by the challenging winter season in the Brazilian market, which had significant increases in cruise business capacity. Net onboard and other revenue yields increased 1.8% on a constant dollar basis due to higher onboard spending by our guests. Gross cruise... -
Page 54
...shares in open market transactions during fiscal 2011, which represented all of our $1.1 billion of fiscal 2011 free cash flow. Future Commitments and Funding Sources At November 30, 2011, our contractual cash obligations were as follows (in millions): Payments Due by Fiscal 2012 2013 2014 2015 2016... -
Page 55
... are trading at a price that is at a premium or discount to the price of Carnival plc ordinary shares or Carnival Corporation common stock, as the case may be. This economic benefit is used for general corporate purposes, which could include repurchasing additional stock under the Repurchase Program... -
Page 56
... of our hedging strategies and market risks see the discussion below and "Note 10 - Fair Value Measurements, Derivative Instruments and Hedging Activities," in the accompanying consolidated financial statements. Foreign Currency Exchange Rate Risks Operational and Investment Currency Risks We have... -
Page 57
...At November 30, 2011, we have fuel derivatives for approximately 10% of our estimated fuel consumption for the second half of fiscal 2012 through fiscal 2015. The volume and derivative products used in our fuel derivatives program may change based on our expectation of future market prices. Based on... -
Page 58
... ...Cash used in financing activities ...Dividends paid ...Other Statistical Data ALBDs (in thousands) ...Passengers carried (in thousands) ...Occupancy percentage ...Fuel consumption (metric tons in thousands) ...Fuel cost per metric ton consumed ...Currencies U.S. dollar to â,¬1 ...U.S. dollar to... -
Page 59
... of Directors. Our dividends were and will be based on a number of factors, including our earnings, liquidity position, financial condition, tone of business, capital requirements, credit ratings and the availability and cost of obtaining new debt. We cannot be certain that Carnival Corporation and... -
Page 60
... reinvested on an annual basis, multiplied by the market price of the shares at the end of each fiscal year. 5-YEAR CUMULATIVE TOTAL RETURNS $140 $120 DOLLARS $100 $80 $60 $40 2006 2007 2008 2009 2010 2011 Carnival Corporation Common Stock FTSE 100 Index Dow Jones Travel & Leisure Index... -
Page 61
... the indexes noted below. The Price Performance is calculated in a similar manner as previously discussed. 5-YEAR CUMULATIVE TOTAL RETURNS $140 $120 $100 DOLLARS $80 $60 $40 2006 2007 2008 2009 2010 2011 Carnival plc ADS FTSE 100 Index Dow Jones Travel & Leisure Index S&P 500 Composite... -
Page 62
... North America brands although our North America brands have also been trending towards an increasing level of seasonality. Quarterly financial results for fiscal 2011 were as follows (in millions, except per share data): February 28 Quarters Ended May 31 August 31 November 30 Revenues ...Operating... -
Page 63
... Costa Crociere S.p.A. OTHER SENIOR OFFICERS (CONTINUED) Alfredo Serrano General Director Iberocruceros Ann Sherry Chief Executive Officer Carnival Australia Michael Thamm President AIDA Cruises BOARD OF DIRECTORS Micky Arison 3 Chairman of the Board and Chief Executive Officer Carnival Corporation... -
Page 64
Carnival Place 3665 N.W. 87th Avenue Miami Florida 33178-2428 U.S.A. www.carnivalcorp.com Carnival House 5 Gainsford Street London SE1 2NE UK www.carnivalplc.com