Carnival Cruises 2003 Annual Report Download - page 8
Download and view the complete annual report
Please find page 8 of the 2003 Carnival Cruises annual report below. You can navigate through the pages in the report by either clicking on the pages listed below, or by using the keyword search tool below to find specific information within the annual report.-
 1
1 -
 2
2 -
 3
3 -
 4
4 -
 5
5 -
 6
6 -
 7
7 -
 8
8 -
 9
9 -
 10
10 -
 11
11 -
 12
12 -
 13
13 -
 14
14 -
 15
15 -
 16
16 -
 17
17 -
 18
18 -
 19
19 -
20
-
21
-
22
-
23
-
24
-
25
-
26
-
27
-
28
-
29
-
30
-
31
-
32
-
33
-
34
-
35
-
36
-
37
-
38
-
39
-
40
-
41
-
42
-
43
-
44
-
45
-
46
-
47
-
48
-
49
 |
 |

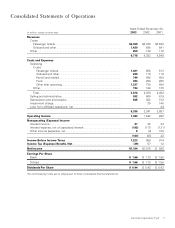
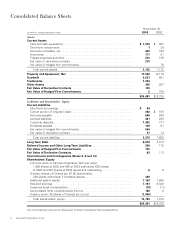
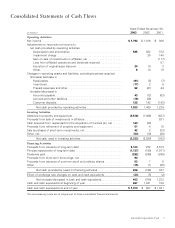
5Carnival Corporation & plc
Years Ended November 30,
(in millions, except per share data) 2003 2002 2001
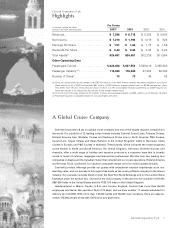
Revenues
Cruise
Passenger tickets. . . . . . . . . . . . . . . . . . . . . . . . . . . . . . . . . . . . . . . . . . $5,039 $3,346 $3,530
Onboard and other . . . . . . . . . . . . . . . . . . . . . . . . . . . . . . . . . . . . . . . . . 1,420 898 841
Other. . . . . . . . . . . . . . . . . . . . . . . . . . . . . . . . . . . . . . . . . . . . . . . . . . . . . 259 139 178
6,718 4,383 4,549
Costs and Expenses
Operating
Cruise
Passenger tickets. . . . . . . . . . . . . . . . . . . . . . . . . . . . . . . . . . . . . . . . 1,021 658 813
Onboard and other . . . . . . . . . . . . . . . . . . . . . . . . . . . . . . . . . . . . . . . 229 116 116
Payroll and related . . . . . . . . . . . . . . . . . . . . . . . . . . . . . . . . . . . . . . . 744 458 459
Food . . . . . . . . . . . . . . . . . . . . . . . . . . . . . . . . . . . . . . . . . . . . . . . . . 393 256 265
Other ship operating. . . . . . . . . . . . . . . . . . . . . . . . . . . . . . . . . . . . . . 1,237 734 694
Other . . . . . . . . . . . . . . . . . . . . . . . . . . . . . . . . . . . . . . . . . . . . . . . . . . . 194 108 135
Total. . . . . . . . . . . . . . . . . . . . . . . . . . . . . . . . . . . . . . . . . . . . . . . . . . . . 3,818 2,330 2,482
Selling and administrative. . . . . . . . . . . . . . . . . . . . . . . . . . . . . . . . . . . . . . 932 609 619
Depreciation and amortization . . . . . . . . . . . . . . . . . . . . . . . . . . . . . . . . . . 585 382 372
Impairment charge. . . . . . . . . . . . . . . . . . . . . . . . . . . . . . . . . . . . . . . . . . . 20 140
Loss from affiliated operations, net . . . . . . . . . . . . . . . . . . . . . . . . . . . . . . 44
5,335 3,341 3,657
Operating Income . . . . . . . . . . . . . . . . . . . . . . . . . . . . . . . . . . . . . . . . . . . . 1,383 1,042 892
Nonoperating (Expense) Income
Interest income . . . . . . . . . . . . . . . . . . . . . . . . . . . . . . . . . . . . . . . . . . . . . 27 32 34
Interest expense, net of capitalized interest . . . . . . . . . . . . . . . . . . . . . . . . (195) (111) (121)
Other income (expense), net . . . . . . . . . . . . . . . . . . . . . . . . . . . . . . . . . . . 8(4) 109
(160) (83) 22
Income Before Income Taxes . . . . . . . . . . . . . . . . . . . . . . . . . . . . . . . . . . . 1,223 959 914
Income Tax (Expense) Benefit, Net . . . . . . . . . . . . . . . . . . . . . . . . . . . . . . . (29) 57 12
Net Income . . . . . . . . . . . . . . . . . . . . . . . . . . . . . . . . . . . . . . . . . . . . . . . . . $1,194 $1,016 $ 926
Earnings Per Share
Basic . . . . . . . . . . . . . . . . . . . . . . . . . . . . . . . . . . . . . . . . . . . . . . . . . . . . . $ 1.66 $ 1.73 $ 1.58
Diluted. . . . . . . . . . . . . . . . . . . . . . . . . . . . . . . . . . . . . . . . . . . . . . . . . . . . $ 1.66 $ 1.73 $ 1.58
Dividends Per Share . . . . . . . . . . . . . . . . . . . . . . . . . . . . . . . . . . . . . . . . . . $ 0.44 $ 0.42 $ 0.42
The accompanying notes are an integral part of these consolidated financial statements.
Consolidated Statements of Operations