Cardinal Health 2014 Annual Report Download - page 11
Download and view the complete annual report
Please find page 11 of the 2014 Cardinal Health annual report below. You can navigate through the pages in the report by either clicking on the pages listed below, or by using the keyword search tool below to find specific information within the annual report.-
 1
1 -
 2
2 -
 3
3 -
 4
4 -
 5
5 -
 6
6 -
 7
7 -
 8
8 -
 9
9 -
 10
10 -
 11
11 -
 12
12 -
 13
13 -
 14
14 -
 15
15 -
 16
16 -
 17
17 -
 18
18 -
 19
19 -
 20
20 -
 21
21 -
 22
22 -
23
-
24
-
25
-
26
-
27
-
28
-
29
-
30
-
31
-
32
-
33
-
34
-
35
-
36
-
37
-
38
-
39
-
40
-
41
-
42
-
43
-
44
-
45
-
46
-
47
-
48
-
49
-
50
-
51
-
52
-
53
-
54
-
55
-
56
-
57
-
58
 |
 |

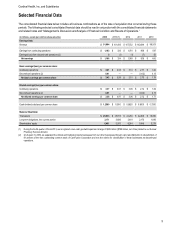
Cardinal Health, Inc. and Subsidiaries
Selected Financial Data
9
The consolidated financial data below includes all business combinations as of the date of acquisition that occurred during these
periods. The following selected consolidated financial data should be read in conjunction with the consolidated financial statements
and related notes and “Management’s Discussion and Analysis of Financial Condition and Results of Operations.”
(in millions, except per common share amounts) 2014 2013 (1) 2012 2011 2010
Earnings Data:
Revenue $91,084 $ 101,093 $ 107,552 $ 102,644 $ 98,503
Earnings from continuing operations $ 1,163 $ 335 $ 1,070 $ 966 $587
Earnings/(loss) from discontinued operations (2) 3(1)(1)(7)55
Net earnings $ 1,166 $ 334 $ 1,069 $ 959 $642
Basic earnings/(loss) per common share:
Continuing operations $3.41 $0.98 $3.10 $2.77 $1.64
Discontinued operations (2) 0.01 — — (0.02)0.15
Net basic earnings per common share $ 3.42 $0.98 $3.10 $2.75 $1.79
Diluted earnings/(loss) per common share:
Continuing operations $3.37 $0.97 $3.06 $2.74 $1.62
Discontinued operations (2) 0.01 — — (0.02)0.15
Net diluted earnings per common share $ 3.38 $0.97 $3.06 $2.72 $1.77
Cash dividends declared per common share $1.2500 $1.0900 $0.8825 $0.8000 $0.7200
Balance Sheet Data:
Total assets $26,033 $25,819 $24,260 $22,846 $19,990
Long-term obligations, less current portion 3,171 3,686 2,418 2,175 1,896
Shareholders’ equity 6,401 5,975 6,244 5,849 5,276
(1) During the fourth quarter of fiscal 2013, we recognized a non-cash goodwill impairment charge of $829 million ($799 million, net of tax) related to our Nuclear
Pharmacy Services division.
(2) On August 31, 2009, we separated the clinical and medical products businesses from our other businesses through a pro rata distribution to shareholders of
81 percent of the then outstanding common stock of CareFusion Corporation and met the criteria for classification of these businesses as discontinued
operations.