Callaway 1997 Annual Report Download - page 2
Download and view the complete annual report
Please find page 2 of the 1997 Callaway annual report below. You can navigate through the pages in the report by either clicking on the pages listed below, or by using the keyword search tool below to find specific information within the annual report.-
 1
1 -
 2
2 -
 3
3 -
 4
4 -
 5
5 -
 6
6 -
 7
7 -
 8
8 -
 9
9 -
 10
10 -
 11
11 -
 12
12 -
 13
13 -
14
-
15
-
16
-
17
-
18
-
19
-
20
-
21
-
22
-
23
-
24
-
25
-
26
-
27
 |
 |

1
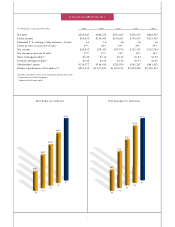
FI N A N C I A L HI G H L I G H TS
Net Sa l e s (in millions) Net In c o m e (in millions)
93 94
95 96 97
$255
$449
$553
$679
$843
93 94
95 96 97
$43
$78
$98
$122
$133
(in thousands, except per share data) 1993 1994 1995 1996 1997
Net sales $254,645 $448,729 $553,287 $678,512 $842,927
Pretax income $69,600 $129,405 $158,401 $195,595 $213,765
Estimated U.S. ranking within industry—$ sales** 1st 1st 1st 1st 1st
Pretax income as a percent of sales 27% 29% 29% 29% 25%
Net income $42,862*$78,022 $97,736 $122,337 $132,704
Net income as percent of sales 17%*17% 18% 18% 16%
Basic earnings per share*** $0.68*$1.14 $1.47 $1.83 $1.94
Diluted earnings per share*** $0.62*$1.07 $1.40 $1.73 $1.85
Shareholders’ equity $116,577 $186,414 $224,934 $362,267 $481,425
Market capitalization at December 31 $901,910 $1,127,823 $1,604,741 $2,094,588 $2,120,813
*Includes cumulative effect of an accounting change of $1,658
**Estimated by Golf Pro Magazine
***Adjusted for all stock splits