Cabela's 2012 Annual Report Download - page 8
Download and view the complete annual report
Please find page 8 of the 2012 Cabela's annual report below. You can navigate through the pages in the report by either clicking on the pages listed below, or by using the keyword search tool below to find specific information within the annual report.-
 1
1 -
 2
2 -
 3
3 -
 4
4 -
 5
5 -
 6
6 -
 7
7 -
 8
8 -
 9
9 -
 10
10 -
 11
11 -
 12
12 -
 13
13 -
 14
14 -
 15
15 -
 16
16 -
 17
17 -
 18
18 -
 19
19 -
20
-
21
-
22
-
23
-
24
-
25
-
26
-
27
-
28
-
29
-
30
-
31
-
32
-
33
-
34
-
35
-
36
-
37
-
38
-
39
-
40
-
41
-
42
-
43
-
44
-
45
-
46
-
47
-
48
-
49
-
50
-
51
-
52
-
53
-
54
-
55
-
56
-
57
-
58
-
59
-
60
-
61
-
62
-
63
-
64
-
65
-
66
-
67
-
68
-
69
-
70
-
71
-
72
-
73
-
74
-
75
-
76
-
77
-
78
-
79
-
80
-
81
-
82
-
83
-
84
-
85
-
86
-
87
-
88
-
89
-
90
-
91
-
92
-
93
-
94
-
95
-
96
-
97
-
98
-
99
-
100
-
101
-
102
-
103
-
104
-
105
-
106
-
107
-
108
-
109
-
110
-
111
-
112
-
113
-
114
-
115
-
116
-
117
-
118
-
119
-
120
-
121
-
122
-
123
-
124
-
125
-
126
-
127
-
128
-
129
-
130
-
131
-
132
-
133
-
134
-
135
 |
 |

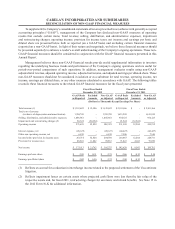
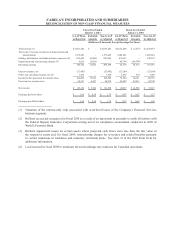
CABELA’S INCORPORATED AND SUBSIDIARIES
RECONCILIATION OF NON-GAAP FINANCIAL MEASURES
Fiscal Year Ended
January 1, 2011
Fiscal Year Ended
January 2, 2010
GAAP Basis
as Reported
Excluded
Amounts
Non-GAAP
as Adjusted
GAAP Basis
as Reported
Excluded
Amounts
Non-GAAP
as Adjusted
(Dollars in Thousands Except Earnings Per Share)
Total revenue (1) $2,663,242 $ - $2,663,242 $2,632,240 $ (2,557) $ 2,629,683
Total cost of revenue (exclusive of depreciation and
amortization) 1,575,449 - 1,575,449 1,602,621 - 1,602,621
Selling, distribution, and administrative expenses (2) 895,405 (8,000) 887,405 870,147 - 870,147
Impairment and restructuring charges (3) 5,626 (5,626) - 66,794 (66,794) -
Operating income 186,762 13,626 200,388 92,678 64,237 156,915
Interest expense, net (27,442) - (27,442) (23,109) - (23,109)
Other non-operating income, net (4) 7,360 - 7,360 6,955 574 7,529
Income before provision for income taxes 166,680 13,626 180,306 76,524 64,811 141,335
Provision for income taxes 54,521 4,457 58,978 26,907 22,813 49,720
Net income $ 112,159 $ 9,169 $ 121,328 $ 49,617 $ 41,998 $ 91,615
Earnings per basic share $ 1.65 $ 0.14 $ 1.79 $ 0.74 $ 0.63 $ 1.37
Earnings per diluted share $ 1.62 $ 0.14 $ 1.76 $ 0.74 $ 0.62 $ 1.36
(1) Valuation of the interest-only strip associated with securitized loans of the Company’s Financial Services
business segment.
(2) Reflects an accrual recognized in fiscal 2010 as a result of an agreement in principle to settle all matters with
the Federal Deposit Insurance Corporation arising out of its compliance examination conducted in 2009 of
World’s Foremost Bank.
(3) Reflects impairment losses on certain assets where projected cash flows were less than the fair value of
the respective assets and, for fiscal 2009, restructuring charges for severance and related benefits pursuant
to certain reductions in workforce and voluntary retirement plans. See Note 15 in the 2010 Form 10-K for
additional information.
(4) Loss incurred in fiscal 2009 to terminate forward exchange rate contracts for Canadian operations.