Cabela's 2012 Annual Report Download - page 7
Download and view the complete annual report
Please find page 7 of the 2012 Cabela's annual report below. You can navigate through the pages in the report by either clicking on the pages listed below, or by using the keyword search tool below to find specific information within the annual report.-
 1
1 -
 2
2 -
 3
3 -
 4
4 -
 5
5 -
 6
6 -
 7
7 -
 8
8 -
 9
9 -
 10
10 -
 11
11 -
 12
12 -
 13
13 -
 14
14 -
 15
15 -
 16
16 -
 17
17 -
 18
18 -
19
-
20
-
21
-
22
-
23
-
24
-
25
-
26
-
27
-
28
-
29
-
30
-
31
-
32
-
33
-
34
-
35
-
36
-
37
-
38
-
39
-
40
-
41
-
42
-
43
-
44
-
45
-
46
-
47
-
48
-
49
-
50
-
51
-
52
-
53
-
54
-
55
-
56
-
57
-
58
-
59
-
60
-
61
-
62
-
63
-
64
-
65
-
66
-
67
-
68
-
69
-
70
-
71
-
72
-
73
-
74
-
75
-
76
-
77
-
78
-
79
-
80
-
81
-
82
-
83
-
84
-
85
-
86
-
87
-
88
-
89
-
90
-
91
-
92
-
93
-
94
-
95
-
96
-
97
-
98
-
99
-
100
-
101
-
102
-
103
-
104
-
105
-
106
-
107
-
108
-
109
-
110
-
111
-
112
-
113
-
114
-
115
-
116
-
117
-
118
-
119
-
120
-
121
-
122
-
123
-
124
-
125
-
126
-
127
-
128
-
129
-
130
-
131
-
132
-
133
-
134
-
135
 |
 |

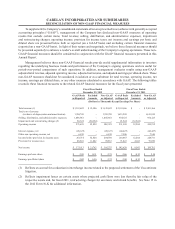
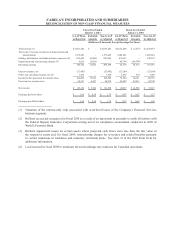
CABELA’S INCORPORATED AND SUBSIDIARIES
RECONCILIATION OF NON-GAAP FINANCIAL MEASURES
To s upplement the Compa ny’s consolidate d state ments of income p re sente d i n accordance w ith gener al ly a ccepte d
accounting principles (“GAAP”), management of the Company has disclosed non-GAAP measures of operating
results that exclude certain items. Total revenue; selling, distribution, and administrative expenses; impairment
and restructuring charges; operating income; provision for income taxes; net income; and earnings per basic and
diluted share are presented below both as reported (on a GAAP basis) and excluding certain financial measures
(reported on a non-GAAP basis). In light of their nature and magnitude, we believe these financial measures should
be presented separately to enhance a reader’s overall understanding of the Company’s ongoing operations. These non-
GAAP financial measures should be considered in conjunction with the GAAP financial measures presented in this
Annual Report.
Management believes these non-GAAP financial results provide useful supplemental information to investors
regarding the underlying business trends and performance of the Company’s ongoing operations and are useful for
period-over-period comparisons of such operations. In addition, management evaluates results using non-GAAP
adjusted total revenue, adjusted operating income, adjusted net income, and adjusted earnings per diluted share. These
non-GAAP measures should not be considered in isolation or as a substitute for total revenue, operating income, net
income, earnings per diluted share, or any other measure calculated in accordance with GAAP. The following tables
reconcile these financial measures to the related GAAP financial measures for the fiscal years presented.
Fiscal Year Ended
December 29, 2012
Fiscal Year Ended
December 31, 2011
GAAP Basis
as Reported
Excluded
Amounts
Non-GAAP
as Adjusted
GAAP Basis
as Reported
Excluded
Amounts
Non-GAAP
as Adjusted
(Dollars in Thousands Except Earnings Per Share)
Total revenue (1) $ 3,112,682 $ 12,500 $ 3,125,182 $ 2,811,166 $ - $ 2,811,166
Total cost of revenue
(exclusive of depreciation and amortization) 1,769,798 - 1,769,798 1,613,249 - 1,613,249
Selling, distribution, and administrative expenses 1,046,861 - 1,046,861 954,125 - 954,125
Impairment and restructuring charges (2) 20,324 (20,324) - 12,244 (12,244) -
Operating income 275,699 32,824 308,523 231,548 12,244 243,792
Interest expense, net (20,123) - (20,123) (24,427) - (24,427)
Other non-operating income, net 6,138 - 6,138 7,346 - 7,346
Income before provision for income taxes 261,714 32,824 294,538 214,467 12,244 226,711
Provision for income taxes 88,201 11,062 99,263 71,847 4,102 75,949
Net income $173,513$21,762$195,275$142,620$8,142$150,762
Earnings per basic share $ 2.48 $ 0.31 $ 2.79 $ 2.06 $ 0.12 $ 2.18
Earnings per diluted share $ 2.42 $ 0.30 $ 2.72 $ 2.00 $ 0.12 $ 2.12
(1) Reflects an accrual for a reduction in interchange income related to the proposed settlement of the Visa antitrust
litigation.
(2) Reflects impairment losses on certain assets where projected cash flows were less than the fair value of the
respective assets and, for fiscal 2011, restructuring charges for severance and related benefits. See Note 15 in
the 2012 Form 10-K for additional information.