Buffalo Wild Wings 2013 Annual Report Download - page 15
Download and view the complete annual report
Please find page 15 of the 2013 Buffalo Wild Wings annual report below. You can navigate through the pages in the report by either clicking on the pages listed below, or by using the keyword search tool below to find specific information within the annual report.-
 1
1 -
2
-
3
-
4
-
 5
5 -
 6
6 -
 7
7 -
 8
8 -
 9
9 -
 10
10 -
 11
11 -
 12
12 -
 13
13 -
 14
14 -
 15
15 -
 16
16 -
 17
17 -
 18
18 -
 19
19 -
 20
20 -
 21
21 -
 22
22 -
 23
23 -
 24
24 -
 25
25 -
26
-
27
-
28
-
29
-
30
-
31
-
32
-
33
-
34
-
35
 |
 |

28
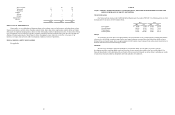
Increases in comparable same-store sales are as follows (based on restaurants operating at least fifteen months):
Fiscal Years Ended
Dec. 29,
2013 Dec. 30,
2012
Dec. 25,
2011
Company-owned same-store sales 3.9% 6.6% 6.1%
Franchised same-store sales 3.3 6.5 3.6
The annual average prices paid per pound for chicken wings for company-owned restaurants are as follows:
Fiscal Years Ended
Dec. 29,
2013 Dec. 30,
2012
Dec. 25,
2011
Average price per pound $ 1.76 1.97 1.21
Fiscal Year 2013 Compared to Fiscal Year 2012
Restaurant sales increased by $221.4 million, or 23.0%, to $1.2 billion in 2013 from $964.0 million in 2012. The
increase in restaurant sales was due to a $210.5 million increase associated with 55 new company-owned restaurants that
opened or were acquired in 2013 and the company-owned restaurants opened before 2013 that did not meet the criteria for
same-store sales for all or part of the year, and $33.2 million related to a 3.9% increase in same-store sales. The 53rd week of
2012 contributed an additional $22.3 million in sales.
Franchise royalties and fees increased by $4.8 million, or 6.3%, to $81.4 million in 2013 from $76.6 million in 2012.
The increase was due primarily to additional sales at 49 more franchised restaurants in operation at the end of the period
compared to prior year, and an increase in same-store sales for franchised restaurants of 3.3% in 2013.
Cost of sales increased by $60.1 million, or 19.8%, to $363.8 million in 2013 from $303.7 million in 2012 due
primarily to more restaurants being operated in 2013. Cost of sales as a percentage of restaurant sales decreased to 30.7% in
2013 from 31.5% in 2012, primarily due to lower chicken wing prices and the rollout of Wings by Portion. In 2013, the cost
of chicken wings averaged $1.76 per pound which was a 10.7% decrease compared to 2012.
Labor expenses increased by $71.1 million, or 24.6%, to $360.3 million in 2013 from $289.2 million in 2012 due
primarily to more restaurants being operated in 2013. Labor expenses as a percentage of restaurant sales increased to 30.4%
in 2013 from 30.0% in 2012. Cost of labor as a percentage of restaurant sales increased primarily due to higher costs
associated with our Guest Experience Business Model.
Operating expenses increased by $32.9 million, or 23.3%, to $174.3 million in 2013 from $141.4 million in 2012 due
primarily to more restaurants being operated in 2013. Operating expenses as a percentage of restaurant sales remained
consistent at 14.7% in 2013 and 2012. Repair and maintenance cost increases were offset by decreases in supplies and
insurance costs.
Occupancy expenses increased by $14.2 million, or 26.3%, to $68.4 million in 2013 from $54.1 million in 2012 due
primarily to more restaurants being operated in 2013. Occupancy expenses as a percentage of restaurant sales increased to
5.8% in 2013 from 5.6% in 2012 due primarily to deleveraging rent costs associated with the lower same-store sales increase.
Depreciation and amortization increased by $17.5 million, or 26.0%, to $85.0 million in 2013 from $67.5 million in
2012. The increase was primarily due to the additional depreciation on 52 new restaurants that opened in 2013 and 3
franchised locations that were acquired in 2013. Depreciation and amortization expense as a percentage of total revenue
increased to 6.7% in 2013 from 6.5% in 2012 due primarily to higher depreciation on company-owned buildings and
amortization related to reacquired franchise rights.
General and administrative expenses increased by $12.0 million, or 14.3%, to $96.2 million in 2013 from $84.1 million
in 2012. General and administrative expenses as a percentage of total revenue decreased to 7.6% in 2013 from 8.1% in 2012.
Exclusive of stock-based compensation, our general and administrative expenses decreased to 6.7% of total revenue in 2013
from 7.3% in 2012. This decrease was primarily due to leveraging of salaries against higher total revenues and lower travel
costs.
Preopening costs remained consistent at $14.6 million in 2013 and 2012. In 2013, we incurred costs of $13.7 million
for 52 new company-owned restaurants and costs of $943,000 for restaurants that will open in 2014. In 2012, we incurred
costs of $13.4 million for 51 new company-owned restaurants and costs of $1.2 million for restaurants that opened in 2013.
Average preopening cost per restaurant in 2013 and 2012 was $290,000 and $281,000, respectively.
29
Loss on asset disposals and impairment remained consistent at $3.3 million in 2013 and 2012. The expense in 2013
represented the impairment of the assets of two restaurants of $1.1 million and the write-off of miscellaneous equipment and
disposals due to remodels. The expense in 2012 represented the closures costs for seven closed or relocated restaurants of
$413,000, the write-off of equipment related to the rollout of new point-of-sale and back-office systems of $1.3 million, and
the write-off of miscellaneous equipment and disposals due to remodels.
Investment income decreased by $80,000 to $674,000 in 2013 from $754,000 in 2012. As of the end of 2013, our
marketable securities balance consisted of deferred compensation investments which were primarily mutual funds. The
income in both 2013 and 2012 was primarily related to investments held for our deferred compensation plan. Cash and
marketable securities balances at the end of the year were $65.1 million in 2013 compared to $30.9 million in 2012.
Provision for income taxes increased $3.9 million to $30.0 million in 2013 from $26.1 million in 2012. The effective
tax rate as a percentage of income before taxes decreased to 29.5% in 2013 from 31.3% in 2012. The rate decrease was
primarily due the favorable impact of the American Taxpayer Relief Act of 2012 that was enacted in 2013. We estimate our
effective tax rate in 2014 will be about 33% based on current tax law, and would decrease to 31.5% if Congress renews the
employment credits.
Fiscal Year 2012 Compared to Fiscal Year 2011
Restaurant sales increased by $246.6 million, or 34.4%, to $964.0 million in 2012 from $717.4 million in 2011. The
increase in restaurant sales was due to a $182.7 million increase associated with 69 company-owned restaurants that opened
or were acquired in 2012 and the company-owned restaurants that opened or were acquired before 2012 that did not meet the
criteria for same-store sales for all, or part, of the year. The 53rd week of 2012 contributed an additional $22.3 million. A
same-store sales increase of 6.6% accounted for $41.6 million of the increase in restaurant sales.
Franchise royalties and fees increased by $9.5 million, or 14.1%, to $76.6 million in 2012 from $67.1 million in 2011.
The increase was primarily due to royalties related to additional sales at 12 more franchised restaurants in operation at the
end of the period compared to prior year, and an increase in same-store sales for franchised restaurants of 6.5% in 2012. In
the 53rd week of fiscal 2012, we recognized $1.5 million in franchise royalties and fees.
Cost of sales increased by $100.4 million, or 49.4%, to $303.7 million in 2012 from $203.3 million in 2011 due
primarily to more restaurants being operated in 2012. Cost of sales as a percentage of restaurant sales increased to 31.5% in
2012 from 28.3% in 2011. Cost of sales as a percentage of restaurant sales increased primarily due to higher chicken wing
prices and a lower wing-per-pound yield. In 2012, chicken wings averaged $1.97 per pound which was a 62.8% increase
compared to 2011.
Labor expenses increased by $73.5 million, or 34.1%, to $289.2 million in 2012 from $215.6 million in 2011 due
primarily to more restaurants being operated in 2012. Labor expenses as a percentage of restaurant sales decreased slightly to
30.0% in 2012 compared to 30.1% in 2011. The decrease in labor expenses as a percentage of restaurant sales is primarily
due to lower management costs and payroll related taxes partially offset by higher hourly labor costs and health insurance
costs.
Operating expenses increased by $31.8 million, or 29.0%, to $141.4 million in 2012 from $109.7 million in 2011 due
primarily to more restaurants being operated in 2012. Operating expenses as a percentage of restaurant sales decreased to
14.7% in 2012 from 15.3% in 2011. The decrease in operating expenses as a percentage of restaurant sales was primarily due
to lower utility costs and credit card fees.
Occupancy expenses increased by $10.1 million, or 23.0%, to $54.1 million in 2012 from $44.0 million in 2011 due
primarily to more restaurants being operated in 2012. Occupancy expenses as a percentage of restaurant sales decreased to
5.6% in 2012 from 6.1% in 2011 due primarily to leveraging rent costs with higher sales and a shift toward more company-
owned buildings.
Depreciation and amortization increased by $17.5 million, or 35.2%, to $67.5 million in 2012 from $49.9 million in
2011. The increase was primarily due to the additional depreciation related to the 62 additional company-owned restaurants
compared to 2011 and incremental amortization related to the acquisition of franchised restaurants.
General and administrative expenses increased by $11.5 million, or 15.8%, to $84.1 million in 2012 from $72.7 million
in 2011 primarily due to additional headcount partially offset by lower stock-based compensation expense. General and
administrative expenses as a percentage of total revenue decreased to 8.1% in 2012 from 9.3% in 2011. Exclusive of stock-
based compensation, our general and administrative expenses decreased to 7.3% of total revenue in 2012 from 7.8% in 2011.