Buffalo Wild Wings 2013 Annual Report Download - page 12
Download and view the complete annual report
Please find page 12 of the 2013 Buffalo Wild Wings annual report below. You can navigate through the pages in the report by either clicking on the pages listed below, or by using the keyword search tool below to find specific information within the annual report.-
 1
1 -
 2
2 -
 3
3 -
 4
4 -
 5
5 -
 6
6 -
 7
7 -
 8
8 -
 9
9 -
 10
10 -
 11
11 -
 12
12 -
 13
13 -
 14
14 -
 15
15 -
 16
16 -
 17
17 -
 18
18 -
 19
19 -
 20
20 -
 21
21 -
 22
22 -
23
-
24
-
25
-
26
-
27
-
28
-
29
-
30
-
31
-
32
-
33
-
34
-
35
 |
 |

22
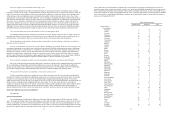
Stock Performance Chart
The following graph compares the yearly percentage change in the cumulative total shareholder return on our Common
Stock for the five-year period ended December 29, 2013 with the cumulative total return on the Nasdaq Composite and the
S&P 600 Restaurants Index. The comparison assumes $100 was invested in Buffalo Wild Wings Common Stock on
December 28, 2008, and in each of the foregoing indices on December 28, 2008 and assumes reinvestment of dividends.
$0
$100
$200
$300
$400
$500
$600
$700
12/28/08 12/27/09 12/26/10 12/25/11 12/30/12 12/29/13
COMPARISON OF 5 YEAR CUMULATIVE TOTAL RETURN*
Among Buffalo Wild Wings, Inc., the NASDAQ Composite Index, and S&P 600 Restaurants Index
Buffalo Wild Wings, Inc. NASDAQ Composite S&P 600 Restaurants Index
*$100 invested on 12/28/08 in stock or 12/31/08 in index, including reinvestment of dividends.
Indexes calculated on month-end basis.
Copyright© 2014 S&P, a division of The McGraw-Hill Companies Inc. All rights reserved.
12/28/08 12/27/09 12/26/10 12/25/11 12/30/12 12/29/13
Buffalo Wild Wings, Inc. 100.00 173.62 181.92 276.05 291.02 590.94
NASDAQ Composite 100.00 144.84 170.58 171.34 200.03 283.43
S&P 600 Restaurants Index 100.00 136.39 185.18 184.71 221.49 357.09
The preceding stock performance chart is furnished and not filed with the Securities and Exchange Commission.
Notwithstanding anything to the contrary set forth in any of our previous filings made under the Securities Act of 1933 or the
Securities Exchange Act of 1934 that incorporate future filings made by us under those statutes, the above stock performance
chart is not to be incorporated by reference in any prior filings, nor shall it be incorporated by reference into any future filings
made by us under those statutes.
23
ITEM 6. SELECTED FINANCIAL DATA
The following summary information should be read in conjunction with the Consolidated Financial Statements and
related notes thereto set forth in Item 8 of this Form 10-K.
Fiscal Years Ended (1)
Dec. 29,
2013 Dec. 30,
2012 Dec. 25,
2011 Dec. 26,
2010
Dec. 27,
2009
(in thousands, except share and per share data)
Consolidated Statements of Earnings Data:
Revenue:
Restaurant sales $ 1,185,351 963,963 717,395 555,184 488,702
Franchise royalties and fees 81,368 76,567 67,083 58,072 50,222
Total revenue 1,266,719 1,040,530 784,478 613,256 538,924
Costs and expenses:
Restaurant operating costs:
Cost of sales 363,755 303,653 203,291 160,877 147,659
Labor 360,302 289,167 215,649 167,193 146,555
Operating 174,338 141,417 109,654 88,694 76,358
Occupancy 68,394 54,147 44,005 36,501 32,362
Depreciation and amortization 84,978 67,462 49,913 39,205 32,605
General and administrative 96,182 84,149 72,689 53,996 49,404
Preopening 14,647 14,630 14,564 8,398 7,702
Loss on asset disposals and impairment 3,262 3,291 1,929 2,051 1,928
Total costs and expenses 1,165,858 957,916 711,694 556,915 494,573
Income from operations 100,861 82,614 72,784 56,341 44,351
Investment income 674 754 118 684 1,077
Earnings before income taxes 101,535 83,368 72,902 57,025 45,428
Income tax expense 29,981 26,093 22,476 18,625 14,757
N
et earnings $ 71,554 57,275 50,426 38,400 30,671
Earnings per common share – basic $ 3.81 3.08 2.75 2.11 1.70
Earnings per common share – diluted 3.79 3.06 2.73 2.10 1.69
Weighted average shares outstanding – basic 18,770,000 18,582,000 18,337,000 18,175,000 18,010,000
Weighted average shares outstanding – diluted 18,872,000 18,705,000 18,483,000 18,270,000 18,177,000
Consolidated Statements of Cash Flow Data:
N
et cash provided by operating activities $ 179,360 145,188 148,260 89,699 79,286
N
et cash used in investing activities (145,741) (142,753) (146,682) (85,226) (79,172)
N
et cash (used in) provided by financing activities 3,039 (1,588) 3,690 1,265 1,119
As Of (1)
Dec. 29,
2013 Dec. 30,
2012 Dec. 25,
2011 Dec. 26,
2010
Dec. 27,
2009
(in thousands)
Consolidated Balance Sheets Data:
Total current assets $ 182,756 125,536 139,245 134,204 98,523
Total assets 705,728 591,087 495,359 380,357 309,073
Total current liabilities 166,474 140,843 114,270 79,116 66,704
Total liabilities 239,920 207,715 177,373 123,536 99,240
Retained earnings 333,601 262,047 204,772 154,346 115,946
Total stockholders’ equity 465,808 383,372 317,986 256,821 209,833
(1) We utilize a 52- or 53-week accounting period that ends on the last Sunday in December. Each of the fiscal years in the three years ended December 25, 2011
were comprised of 52 weeks. The fiscal year ended December 30, 2012 was a 53-week year. The fiscal year ended December 29, 2013 was a 52-week year.