Buffalo Wild Wings 2013 Annual Report Download - page 14
Download and view the complete annual report
Please find page 14 of the 2013 Buffalo Wild Wings annual report below. You can navigate through the pages in the report by either clicking on the pages listed below, or by using the keyword search tool below to find specific information within the annual report.-
 1
1 -
2
-
3
-
 4
4 -
 5
5 -
 6
6 -
 7
7 -
 8
8 -
 9
9 -
 10
10 -
 11
11 -
 12
12 -
 13
13 -
 14
14 -
 15
15 -
 16
16 -
 17
17 -
 18
18 -
 19
19 -
 20
20 -
 21
21 -
 22
22 -
 23
23 -
 24
24 -
25
-
26
-
27
-
28
-
29
-
30
-
31
-
32
-
33
-
34
-
35
 |
 |

26
impairments were recognized in fiscal 2012 or 2011. We are currently monitoring several restaurants in regards to the
valuation of long-lived assets. Based on our current estimates of the future operating results of these restaurants, we believe
that the assets at these restaurants are not impaired. As we periodically refine our estimated future operating results, changes
in our estimates and assumptions may cause us to realize impairment charges in the future. We do not believe that these
charges would be material.
In addition to the valuation of long-lived assets, we also record a store closing reserve when a restaurant is abandoned
due to closure or relocation. The store closing reserve is subject to significant judgment as accruals are made for lease
obligations on abandoned leased facilities. Many factors, including the local business environment, other available lease sites,
the willingness of lessors to negotiate lease buyouts, and the ability to sublease our sites are considered in making the
accruals. We estimate future lease obligations based on these factors and evaluate quarterly the adequacy of the estimated
reserve based on current market conditions. During 2013, 2012, and 2011, we recorded expenses of $38,000, $413,000, and
$205,000, respectively, for restaurants that closed.
Goodwill
We review goodwill for impairment annually, or whenever circumstances change in a way which could indicate that
impairment may have occurred. Goodwill is tested at the reporting unit level.
We identify potential goodwill impairments by comparing the fair value of the reporting unit to its carrying amount,
which includes goodwill and other intangible assets. The fair value of the reporting unit is calculated using a market
approach.
If the carrying amount of the reporting unit exceeds the fair value, this is an indication that impairment may exist.
We calculate the amount of the impairment by comparing the fair value of the assets and liabilities to the fair value of the
reporting unit. The fair value of the reporting unit in excess of the value of the assets and liabilities is the implied fair value of
the goodwill. If this amount is less than the carrying amount of goodwill, impairment is recognized for the difference. As of
December 29, 2013, our estimate of the fair value of our goodwill substantially exceeded the carrying value and therefore we
concluded that our goodwill was not impaired. No goodwill impairment charges were recognized during 2013, 2012, or 2011.
Vendor Allowances
Vendor allowances include allowances and other funds received from vendors. Certain of these funds are determined
based on various quantitative contract terms. We also receive vendor allowances from certain manufacturers and distributors
calculated based upon purchases made by franchisees. Amounts that represent a reimbursement of costs incurred, such as
advertising, are recorded as a reduction of the related expense. Amounts that represent a reduction of inventory purchase
costs are recorded as a reduction of inventoriable costs. We record an estimate of earned vendor allowances that are
calculated based upon monthly purchases. We generally receive payment from vendors approximately 30 days after the end
of a month for that month’s purchases. During fiscal 2013, 2012, and 2011, vendor allowances were recorded as a reduction
in inventoriable costs, and cost of sales was reduced by $8.5 million, $8.7 million, and $7.0 million, respectively.
Self-Insurance Liability
We are self-insured for a significant portion of our risks and associated liabilities with respect to workers’
compensation, general liability, and employee health benefits. The accrued liabilities associated with these programs are
based on our estimate of the ultimate costs to settle known claims as well as claims that may have arisen but have not yet
been reported to us as of the balance sheet date. Our estimated liabilities are not discounted and are based on information
provided by our insurance brokers and insurers, combined with our judgments regarding a number of assumptions and
factors, including the frequency and severity of claims, and claims development history. We maintain stop-loss coverage with
third-party insurers to limit our total exposure for each of these programs. Significant judgment is required to estimate claims
incurred but not reported as parties have yet to assert such claims. If actual claims trends, including the frequency or severity
of claims, differ from our estimates, our financial results could be impacted.
Stock-Based Compensation
We account for stock-based compensation in accordance with the fair value recognition provisions, under which we
use the Black-Scholes-Merton pricing model, which requires the input of subjective assumptions. These assumptions include
the expected life of the options, expected volatility over the expected term, the risk-free interest rate, and the expected
forfeitures.
27
Compensation expense for restricted stock units is recognized for the expected number of shares vesting at the end of
each annual period. Restricted stock units granted in 2013, 2012, and 2011 are subject to three-year cliff vesting and a
cumulative three-year earnings target. The number of units that vest is based on performance against the target. Stock-based
compensation is recognized for the expected number of shares vesting at the end of the three-year period and is expensed
over that period. For these restricted stock unit grants, significant assumptions are made to estimate the expected net earnings
levels for future years.
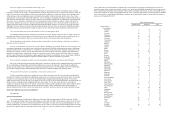
Results of Operations
Our operating results for 2013, 2012, and 2011, are expressed below as a percentage of total revenue, except for the
components of restaurant operating costs, which are expressed as a percentage of restaurant sales.
Fiscal Years Ended
Dec. 29,
2013 Dec. 30,
2012
Dec. 25,
2011
Revenue:
Restaurant sales 93.6% 92.6% 91.4%
Franchise royalties and fees 6.4 7.4 8.6
Total revenue 100.0 100.0 100.0
Costs and expenses:
Restaurant operating costs:
Cost of sales 30.7 31.5 28.3
Labor 30.4 30.0 30.1
Operating 14.7 14.7 15.3
Occupancy 5.8 5.6 6.1
Depreciation and amortization 6.7 6.5 6.4
General and administrative 7.6 8.1 9.3
Preopening 1.2 1.4 1.9
Loss on asset disposals and impairment 0.3 0.3 0.2
Total costs and expenses 92.0 92.1 90.7
Income from operations 8.0 7.9 9.3
Investment income 0.1 0.1 —
Earnings before income taxes 8.0 8.0 9.3
Income tax expense 2.4 2.5 2.9
N
et earnings 5.6% 5.5% 6.4%
The number of company-owned and franchised restaurants open are as follows:
As of
Dec. 29,
2013 Dec. 30,
2012
Dec. 25,
2011
Company-owned restaurants 434 381 319
Franchised restaurants 559 510 498
The restaurant sales for company-owned and franchised restaurants are as follows (amounts in thousands):
Fiscal Years Ended
Dec. 29,
2013 Dec. 30,
2012
Dec. 25,
2011
Company-owned restaurant sales $ 1,185,351 963,963 717,395
Franchised restaurant sales 1,619,526 1,510,020 1,326,213