Buffalo Wild Wings 2013 Annual Report Download - page 13
Download and view the complete annual report
Please find page 13 of the 2013 Buffalo Wild Wings annual report below. You can navigate through the pages in the report by either clicking on the pages listed below, or by using the keyword search tool below to find specific information within the annual report.-
 1
1 -
2
-
 3
3 -
 4
4 -
 5
5 -
 6
6 -
 7
7 -
 8
8 -
 9
9 -
 10
10 -
 11
11 -
 12
12 -
 13
13 -
 14
14 -
 15
15 -
 16
16 -
 17
17 -
 18
18 -
 19
19 -
 20
20 -
 21
21 -
 22
22 -
 23
23 -
24
-
25
-
26
-
27
-
28
-
29
-
30
-
31
-
32
-
33
-
34
-
35
 |
 |

24
ITEM 7. MANAGEMENT’S DISCUSSION AND ANALYSIS OF FINANCIAL CONDITION AND RESULTS OF
OPERATIONS
The following discussion and analysis of our financial condition and results of operations should be read in conjunction
with our consolidated financial statements and related notes. This discussion and analysis contains certain statements that are
not historical facts, including, among others, those relating to our anticipated financial performance for fiscal 2014, cash
requirements, and our expected store openings and preopening costs. Such statements are forward-looking and speak only as
of the date on which they are made. Actual results are subject to various risks and uncertainties including, but not limited to,
those discussed in Item 1A of this 10-K under “Risk Factors.” Information included in this discussion and analysis includes
commentary on company-owned and franchised restaurant units, restaurant sales, same-store sales, and average weekly sales
volumes. Management believes such sales information is an important measure of our performance, and is useful in assessing
consumer acceptance of the Buffalo Wild Wings® concept and the overall health of the concept. Franchise information also
provides an understanding of our revenues because franchise royalties and fees are based on the opening of franchised units
and their sales. However, franchise sales and same-store sales information does not represent sales in accordance with U. S.
Generally Accepted Accounting Principles (GAAP), should not be considered in isolation or as a substitute for other
measures of performance prepared in accordance with GAAP and may not be comparable to financial information as defined
or used by other companies.
Overview
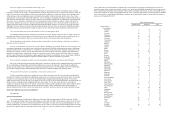
As of December 29, 2013, we owned and operated 434 company-owned and franchised an additional 558 Buffalo Wild
Wings® restaurants in North America and we also franchised one International restaurant. We believe that we will grow the
Buffalo Wild Wings brand to about 1,700 locations in North America, continuing the strategy of developing both company-
owned and franchised restaurants.
We believe we will open 45 company-owned and 50 franchised restaurants in 2014 and have set an annual net earnings
growth goal of 20%. Our growth and success depend on several factors and trends. First, we will continue our focus on trends
in company-owned and franchised same-store sales as an indicator of the continued acceptance of our concept by consumers.
We also review the overall trend in average weekly sales as an indicator of our ability to increase the sales volume and,
therefore, cash flow per location. We remain committed to high quality operations and guest experience.
Our revenue is generated by:
• Sales at our company-owned restaurants, which represented 94% of total revenue in 2013. Food and nonalcoholic
beverages accounted for 78% of restaurant sales. The remaining 22% of restaurant sales was from alcoholic
beverages. The menu items with the highest sales volumes are traditional and boneless wings, each at 20% of total
restaurant sales.
• Royalties and franchise fees received from our franchisees.
A second factor is our success in developing restaurants, including international locations. There are inherent risks in
opening new restaurants, especially in new markets or countries, including the lack of experience, logistical support, and
brand awareness. These factors may result in lower-than-anticipated sales and cash flow for restaurants in new markets, along
with higher preopening costs. We believe our focus on our new restaurant opening procedures, along with our expanding
North American and international presence, will help to mitigate the overall risk associated with opening restaurants in new
markets.
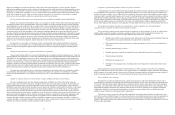
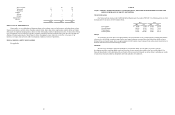
Third, we continue to monitor and react to changes in our cost of sales. The cost of sales is difficult to predict, as it ranged
from 29.8% to 32.7% of restaurant sales per quarter in 2013 and 2012, mostly due to the price and yield fluctuation in
chicken wings. We are focused on minimizing the impact of rising costs per wing, which includes both price increases and yield
fluctuations. Our efforts include wings by portion, new purchasing strategies, menu price increases, reduced food waste, as well as
marketing promotions, menu additions, and menu changes that affect the percent that chicken wings represent in terms of total
restaurant sales. We will continue to monitor the cost of chicken wings, as it can significantly change our cost of sales and cash flow
from company-owned restaurants. Current month chicken wing prices are determined based on the average of the previous month’s
spot rates. The chart below illustrates the fluctuation in chicken wing prices from quarter to quarter in the last five years.
25
We generate cash from the operation of our company-owned restaurants and from franchise royalties and fees. We
highlight the specific costs associated with the on-going operation of our company-owned restaurants in the consolidated
statement of earnings under “Restaurant operating costs.” Our depreciation and amortization expense consists primarily of
depreciation related to assets used by our company-owned restaurants and amortization of reacquired franchise rights.
Preopening costs are those costs associated with opening new company-owned restaurants and will vary annually based on
the number of new locations opening and under construction. Loss on asset disposals and impairment expense is related to
company-owned restaurants and includes the costs associated with normal asset retirements, asset impairment charges, and
closures of locations. General and administrative expenses are related to home office and field support provided to both
company-owned restaurants and franchising operations.
We utilize a 52- or 53-week accounting period that ends on the last Sunday in December. Each of the fiscal years in the
three years ended December 25, 2011 were comprised of 52 weeks. The fiscal year ended December 30, 2012 was a 53-week
year, with the fourth quarter having 14 weeks. The fiscal year ended December 29, 2013 was a 52-week year. Our next 53-
week year will occur in 2017.
Critical Accounting Estimates
Our significant accounting policies are described in Note 1 to the Consolidated Financial Statements, which were
prepared in accordance with GAAP. Critical accounting policies are those that we believe are both important to the portrayal
of our financial condition and results and require our most difficult, subjective or complex judgments, often as a result of the
need to make estimates about the effect of matters that are inherently uncertain.
We believe that the following discussion represents our more critical accounting policies and estimates used in the
preparation of our consolidated financial statements, although it is not all inclusive.
Valuation of Long-Lived Assets and Store Closing Reserves
We review long-lived assets quarterly to determine if triggering events have occurred which would require a test to
determine if the carrying amount of these assets may not be recoverable based on estimated future cash flows. Assets are
reviewed at the lowest level for which cash flows can be identified, which is at the individual restaurant level. In the absence
of extraordinary circumstances, restaurants are included in the impairment analysis after they have been open for 15 months.
We evaluate the recoverability of a restaurant’s long-lived assets, including buildings, intangibles, leasehold improvements,
equipment and fixtures over the remaining life of the primary asset in the asset group, after considering the potential impact
of planned operational improvements, marketing programs, and anticipated changes in the trade area. In determining future
cash flows, significant estimates are made by us with respect to future operating results of each restaurant over its remaining
lease term. If assets are determined to be impaired, the impairment charge is measured by calculating the amount by which
the asset carrying amount exceeds its fair value based on our estimate of discounted future cash flows. The determination of
asset fair value is also subject to significant judgment. During 2013, we recorded restaurant impairments of $1,118,000. No
$0.00
$0.50
$1.00
$1.50
$2.00
$2.50
Q1 Q2 Q3 Q4 Q1 Q2 Q3 Q4 Q1 Q2 Q3 Q4 Q1 Q2 Q3 Q4 Q1 Q2 Q3 Q4
20 09 20 10 20 11 20 12 20 13
($/lbs)
Average Quarterly Wing Prices
2009-2013