Boeing 2012 Annual Report Download - page 3
Download and view the complete annual report
Please find page 3 of the 2012 Boeing annual report below. You can navigate through the pages in the report by either clicking on the pages listed below, or by using the keyword search tool below to find specific information within the annual report.-
 1
1 -
 2
2 -
 3
3 -
 4
4 -
 5
5 -
 6
6 -
 7
7 -
 8
8 -
 9
9 -
 10
10 -
 11
11 -
 12
12 -
 13
13 -
 14
14 -
15
-
16
-
17
-
18
-
19
-
20
-
21
-
22
-
23
-
24
-
25
-
26
-
27
-
28
-
29
-
30
-
31
-
32
-
33
-
34
-
35
-
36
-
37
-
38
-
39
-
40
-
41
-
42
-
43
-
44
-
45
-
46
-
47
-
48
-
49
-
50
-
51
-
52
-
53
-
54
-
55
-
56
-
57
-
58
-
59
-
60
-
61
-
62
-
63
-
64
-
65
-
66
-
67
-
68
-
69
-
70
-
71
-
72
-
73
-
74
-
75
-
76
-
77
-
78
-
79
-
80
-
81
-
82
-
83
-
84
-
85
-
86
-
87
-
88
-
89
-
90
-
91
-
92
-
93
-
94
-
95
-
96
-
97
-
98
-
99
-
100
-
101
-
102
-
103
-
104
-
105
-
106
-
107
-
108
-
109
-
110
-
111
-
112
-
113
-
114
-
115
-
116
-
117
-
118
-
119
-
120
-
121
-
122
-
123
-
124
-
125
-
126
-
127
-
128
-
129
-
130
-
131
-
132
-
133
-
134
-
135
-
136
-
137
-
138
-
139
-
140
-
141
-
142
-
143
-
144
 |
 |

1
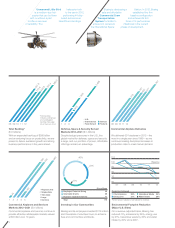
Achieved record revenues of
$81.7 billion, a 19 percent increase
compared to $68.7 billion in 2011,
and reported net income of
$3.9 billion, or $5.11 per share.
Added $114 billion in new
orders, expanding our record
company backlog to more than
$390 billion—nearly five times
current annual revenues.
Further strengthened operat-
ing cash flow to $7.5 billion and
increased cash and marketable
securities to $13.5 billion, ensuring
continued healthy liquidity.
Restored our market-share
leadership with 601 commercial
airplane deliveries—the most
in one year since 1999, includ-
ing 46 787s, the first 747-8
Intercontinental to launch cus-
tomer Lufthansa, the 1,000th
777 and a single-year record 415
deliveries for the 737 program.
Completed delivery of 144
production military aircraft and
10 satellites, increasing Boeing
Defense, Space & Security reve-
nues from 2011.
Won 1,203 commercial air-
plane orders (our second highest
total ever), reaching the 10,000th
order for the 737 program with a
single-year record 1,124 orders,
including 914 orders for the new
737 MAX; recorded Boeing
Commercial Airplanes’ largest
backlog in history at $319 billion,
including 4,373 airplanes.
Grew our Defense, Space &
Security backlog by more than
19 percent to $71 billion on
$44 billion in new orders.
Captured key new and follow-
on defense, space and security
contracts, including CH-47F
Chinook helicopters for Australia
and the United Arab Emirates;
ad ditional F/A-18 aircraft and a
third phase of P-8A Poseidon low-
rate production aircraft for the
U.S. Navy; the C-17 Globemaster III
Integrated Sustainment Program
for the U.S. Air Force; and signif-
icant orders from Saudi Arabia
for new F-15S aircraft, upgrades
to existing F-15 aircraft and new
AH-64 attack helicopters.
Delivered the first Charleston-
built 787s; began major assembly
of the 787-9; and reached our
planned five-airplanes-per-month
production rate on the program.
Achieved key Defense, Space
& Security milestones, including
delivery of the first Block C V-22
Osprey; delivery of the U.S.
Navy’s first production P-8A
Poseidon; completion of full
landing tests of the Crew Space
Transportation spacecraft; start
of production of the first KC-46
Tanker refueling boom; and first
flights of the Blended Wing Body
X-48C experimental aircraft and
the liquid hydrogen–powered
Phantom Eye unmanned air-
craft system.
Continued significant envi-
ronmental progress including
reducing CO2 emissions by
400,000 metric tons over the past
five years while increasing com-
mercial airplane production by
35 percent; successfully flight
testing the 737 ecoDemonstrator,
which tested new technologies to
reduce noise and emissions; and
being recognized as a U.S. EPA
ENERGY STAR Partner of the Year
for the third year in a row.
Operational Summary
2012 2011 2010 2009 2008
Revenues 81,698 68,735 64,306 68,281 60,909
Net earnings 3,900 4,018 3,307 1,312 2,672
Earnings per share* 5.11 5.33 4.46 1.87 3.65
Operating margins 7.7% 8.5% 7.7% 3.1% 6.5%
Operating cash flow 7,508 4,023 2,952 5,603 (401)
Contractual backlog 372,355 339,657 303,955 296,500 323,860
Total backlog† 390,228 355,432 320,826 315,558 351,926
U.S. dollars in millions except per share data
* Represents diluted earnings per share from continuing operations.
†Total backlog includes contractual and unobligated backlog. See page 23 of the Form 10-K.
Financial Highlights