Boeing 2012 Annual Report Download - page 10
Download and view the complete annual report
Please find page 10 of the 2012 Boeing annual report below. You can navigate through the pages in the report by either clicking on the pages listed below, or by using the keyword search tool below to find specific information within the annual report.-
 1
1 -
 2
2 -
 3
3 -
 4
4 -
 5
5 -
 6
6 -
 7
7 -
 8
8 -
 9
9 -
 10
10 -
 11
11 -
 12
12 -
 13
13 -
 14
14 -
 15
15 -
 16
16 -
 17
17 -
 18
18 -
 19
19 -
 20
20 -
 21
21 -
22
-
23
-
24
-
25
-
26
-
27
-
28
-
29
-
30
-
31
-
32
-
33
-
34
-
35
-
36
-
37
-
38
-
39
-
40
-
41
-
42
-
43
-
44
-
45
-
46
-
47
-
48
-
49
-
50
-
51
-
52
-
53
-
54
-
55
-
56
-
57
-
58
-
59
-
60
-
61
-
62
-
63
-
64
-
65
-
66
-
67
-
68
-
69
-
70
-
71
-
72
-
73
-
74
-
75
-
76
-
77
-
78
-
79
-
80
-
81
-
82
-
83
-
84
-
85
-
86
-
87
-
88
-
89
-
90
-
91
-
92
-
93
-
94
-
95
-
96
-
97
-
98
-
99
-
100
-
101
-
102
-
103
-
104
-
105
-
106
-
107
-
108
-
109
-
110
-
111
-
112
-
113
-
114
-
115
-
116
-
117
-
118
-
119
-
120
-
121
-
122
-
123
-
124
-
125
-
126
-
127
-
128
-
129
-
130
-
131
-
132
-
133
-
134
-
135
-
136
-
137
-
138
-
139
-
140
-
141
-
142
-
143
-
144
 |
 |

8
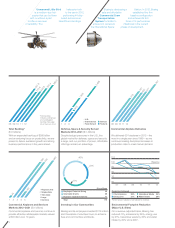
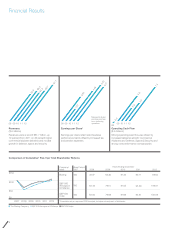
The Boeing Company S&P 500 Aerospace & Defense S&P 500 Index
Comparison of Cumulative* Five-Year Total Shareholder Returns
$0
$150
$100
$50
*Cumulative return assumes $100 invested; includes reinvestment of dividends.
Boeing
S&P 500
Index
S&P 500
Aerospace
& Defense
20082007 2009 2010 2011 2012
Company/
Index
Years Ending December
Base Period
2007
100
100
100
49.97
63.46
63.00
2008
65.82
79.10
79.68
2009
81.35
91.05
91.68
2010
93.71
95.86
93.61
2011 2012
98.62
109.81
108.59
Revenues
($ in billions)
Revenues were a record $81.7 billion, up
19 percent from 2011 on 26 percent higher
commercial airplane deliveries and modest
growth in defense, space and security.
08 09 10 11 12
64.3
68.3
60.9
68.7
81.7
Earnings per Share*
Earnings per share reflect solid business
performance trends offset by increased tax
and pension expenses.
08 09 10 11 12
4.46
1.87
3.65
5.33
5.11
*Represents diluted
earnings per share
from continuing
operations.
Operating Cash Flow
($ in billions)
Strong operating cash flow was driven by
increased deliveries at both Commercial
Airplanes and Defense, Space & Security and
strong core performance companywide.
08 09 10 11 12
-0.4
5.6
2.9
4.0
7.5
Financial Results