Black & Decker 2013 Annual Report Download - page 9
Download and view the complete annual report
Please find page 9 of the 2013 Black & Decker annual report below. You can navigate through the pages in the report by either clicking on the pages listed below, or by using the keyword search tool below to find specific information within the annual report.-
 1
1 -
 2
2 -
 3
3 -
 4
4 -
 5
5 -
 6
6 -
 7
7 -
 8
8 -
 9
9 -
 10
10 -
 11
11 -
 12
12 -
 13
13 -
 14
14 -
 15
15 -
 16
16 -
 17
17 -
 18
18 -
 19
19 -
 20
20 -
21
-
22
-
23
-
24
-
25
-
26
-
27
-
28
-
29
-
30
-
31
-
32
-
33
-
34
-
35
-
36
-
37
-
38
-
39
-
40
-
41
-
42
-
43
-
44
-
45
-
46
-
47
-
48
-
49
-
50
-
51
-
52
-
53
-
54
-
55
-
56
-
57
-
58
-
59
-
60
-
61
-
62
-
63
-
64
-
65
-
66
-
67
-
68
-
69
-
70
-
71
-
72
-
73
-
74
-
75
-
76
-
77
-
78
-
79
-
80
-
81
-
82
-
83
-
84
-
85
-
86
-
87
-
88
-
89
-
90
-
91
-
92
-
93
-
94
-
95
-
96
-
97
-
98
-
99
-
100
-
101
-
102
-
103
-
104
-
105
-
106
-
107
-
108
-
109
-
110
-
111
-
112
-
113
-
114
-
115
-
116
-
117
-
118
-
119
-
120
-
121
-
122
-
123
-
124
-
125
-
126
-
127
-
128
-
129
-
130
-
131
-
132
-
133
-
134
-
135
-
136
-
137
-
138
-
139
-
140
-
141
-
142
-
143
-
144
-
145
-
146
-
147
-
148
-
149
-
150
-
151
-
152
 |
 |

07
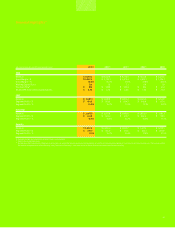
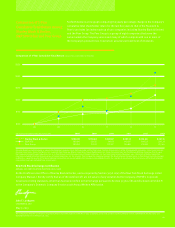
Financial Highlights**
(MILLIONS OF DOLLARS, EXCEPT PER-SHARE AMOUNTS) 2013(1) 2012 (1) 2011 (1) 2010 (1) 2009
SWK
Revenue $ 11,001.2 $ 10,147.9 $ 9,376.5 $ 7,443.8 $ 3,435.6
Gross Margin – $ $ 3,962.4 $ 3,725.1 $ 3,472.2 $ 2,815.1 $ 1,396.1
Gross Margin – % 36.0% 36.7% 37.0% 37.8% 40.6%
Working Capital Turns 8.0 7.6 7.3 5.9 7.9
Free Cash Flow* $ 854 $ 1,059 $ 1,004 $ 936 $ 443
Diluted EPS from Continuing Operations $ 4.98 $ 4.76 $ 4.66 $ 3.54 $ 2.62
CDIY
Revenue $ 5,481.1 $ 5,189.9 $ 5,003.2 $ 4,144.0 $ 1,254.9
Segment Profit – $ $ 811.0 $ 762.6 $ 654.7 $ 542.9 $ 137.4
Segment Profit – % 14.8% 14.7% 13.1% 13.1% 10.9%
Industrial
Revenue $ 3,097.5 $ 2,557.8 $ 2,492.6 $ 1,882.2 $ 881.2
Segment Profit – $ $ 461.0 $ 422.2 $ 415.7 $ 282.4 $ 99.4
Segment Profit – % 14.9% 16.5% 16.7% 15.0% 11.3%
Security
Revenue $ 2,422.6 $ 2,400.2 $ 1,880.7 $ 1,417.6 $ 1,299.5
Segment Profit – $ $ 276.7 $ 354.0 $ 312.6 $ 252.1 $ 278.9
Segment Profit – % 11.4% 14.7% 16.6% 17.8% 21.5%
(1) Excludes merger and acquisition-related charges and payments.
* Refer to the inside back cover.
** During 2013, the Company classified two small businesses within the Security and Industrial segments as held for sale based on management’s intention to sell these businesses. The business within
the Industrial segment was sold in February 2014. The results from 2009–2012 were recast for these discontinued operations for comparability.