Black & Decker 2013 Annual Report Download - page 10
Download and view the complete annual report
Please find page 10 of the 2013 Black & Decker annual report below. You can navigate through the pages in the report by either clicking on the pages listed below, or by using the keyword search tool below to find specific information within the annual report.-
 1
1 -
 2
2 -
 3
3 -
 4
4 -
 5
5 -
 6
6 -
 7
7 -
 8
8 -
 9
9 -
 10
10 -
 11
11 -
 12
12 -
 13
13 -
 14
14 -
 15
15 -
 16
16 -
 17
17 -
 18
18 -
 19
19 -
 20
20 -
 21
21 -
22
-
23
-
24
-
25
-
26
-
27
-
28
-
29
-
30
-
31
-
32
-
33
-
34
-
35
-
36
-
37
-
38
-
39
-
40
-
41
-
42
-
43
-
44
-
45
-
46
-
47
-
48
-
49
-
50
-
51
-
52
-
53
-
54
-
55
-
56
-
57
-
58
-
59
-
60
-
61
-
62
-
63
-
64
-
65
-
66
-
67
-
68
-
69
-
70
-
71
-
72
-
73
-
74
-
75
-
76
-
77
-
78
-
79
-
80
-
81
-
82
-
83
-
84
-
85
-
86
-
87
-
88
-
89
-
90
-
91
-
92
-
93
-
94
-
95
-
96
-
97
-
98
-
99
-
100
-
101
-
102
-
103
-
104
-
105
-
106
-
107
-
108
-
109
-
110
-
111
-
112
-
113
-
114
-
115
-
116
-
117
-
118
-
119
-
120
-
121
-
122
-
123
-
124
-
125
-
126
-
127
-
128
-
129
-
130
-
131
-
132
-
133
-
134
-
135
-
136
-
137
-
138
-
139
-
140
-
141
-
142
-
143
-
144
-
145
-
146
-
147
-
148
-
149
-
150
-
151
-
152
 |
 |

Stanley Black & Decker 2013 Annual Report08
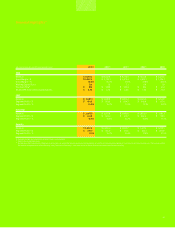
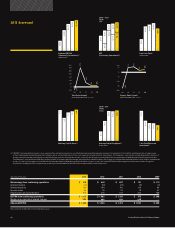
2013 Scorecard
(MILLIONS OF DOLLARS) 2013 2012 2011 2010 2009
Net earnings from continuing operations $ 518 $ 465 $ 607 $ 151 $ 211
Interest income (13) (10) (27) (9) (3)
Interest expense 160 144 140 110 64
Income taxes 69 78 52 19 47
Depreciation and amortization 441 405 367 304 189
EBITDA from continuing operations $ 1,175 $ 1,082 $ 1,139 $ 575 $ 508
Merger and acquisition-related charges 394 442 236 478 —
Adjusted EBITDA $ 1,569 $ 1,524 $ 1,375 $ 1,053 $ 508
(b), (c), (d), (e) and (f) refer to the inside back cover.
2009–2013
CAGR:
+34%
Adjusted EBITDA
(Continuing Operations)(a)
($ MILLIONS)
13
$1,569
12
$1,524
11
$1,375
09
$508
10
$1,053
Working Capital Turns(d)
13
8.0
12
7.6
11
7.3
09
7.9
10
5.9
Free Cash Flow(c)
($ MILLIONS)
13
$8
12
$1,059
11
$1,004
09
$443
10
$936
Cash Flow Return on
Investment(f)
13
.0%
12
10.1%
11
10.2%
09
17.3%
10
11.6%
2009–2013
CAGR:
17%
EPS
(Continuing Operations)(b)
09 10 13
$3.26 $4.98
$4.76
$4.66
$2.62
$2.79
$3.57
11 12
$1.01 $3.54
Average Capital Employed(e)
($ BILLIONS)
13
$10.7
12
$10.4
11
$10.5
09
$3.3
10
$7.0
Total Sales Growth
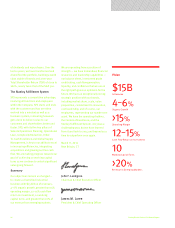
LONG-TERM OBJECTIVE: +10–12%
09
–20
0
20
40
(%)
120
10 11 12 13
8%
-17%
117%
26%
8%
60
80
100
Organic Sales Growth
LONG-TERM OBJECTIVE: +4–6%
09
–20
–15
–5
–10
0
(%)
5
10 11 12 13
3%
-18%
5%
6%
2%
(a) “EBITDA” (earnings before interest, taxes, depreciation and amortization) is a non-GAAP measurement. Management believes it is important for the ability to determine the earnings power
of the Company and to properly value the Company, due to current high levels of non-cash expenses related to recent acquisitions. The Company’s 2013 results exclude $394million (pretax) of
charges related to merger and acquisition-related charges and cost containment actions, as well as the charges associated with the extinguishment of debt during the fourth quarter of 2013.
The Company’s 2012 results exclude $442million (pretax) of charges related to merger and acquisition-related charges, the charges associated with the $200 million in cost actions implemented
in 2012, as well as the charges associated with the extinguishment of debt during the third quarter of 2012. In 2011 and 2010, EBITDA excludes merger and acquisition-related charges of
$236million and $478million, respectively, primarily associated with the Black & Decker merger and Niscayah acquisition.