Big Lots 2014 Annual Report Download - page 7
Download and view the complete annual report
Please find page 7 of the 2014 Big Lots annual report below. You can navigate through the pages in the report by either clicking on the pages listed below, or by using the keyword search tool below to find specific information within the annual report.-
 1
1 -
 2
2 -
 3
3 -
 4
4 -
 5
5 -
 6
6 -
 7
7 -
 8
8 -
 9
9 -
 10
10 -
 11
11 -
 12
12 -
 13
13 -
 14
14 -
 15
15 -
 16
16 -
 17
17 -
 18
18 -
19
-
20
-
21
-
22
-
23
-
24
-
25
-
26
-
27
-
28
-
29
-
30
-
31
-
32
-
33
-
34
-
35
-
36
-
37
-
38
-
39
-
40
-
41
-
42
-
43
-
44
-
45
-
46
-
47
-
48
-
49
-
50
-
51
-
52
-
53
-
54
-
55
-
56
-
57
-
58
-
59
-
60
-
61
-
62
-
63
-
64
-
65
-
66
-
67
-
68
-
69
-
70
-
71
-
72
-
73
-
74
-
75
-
76
-
77
-
78
-
79
-
80
-
81
-
82
-
83
-
84
-
85
-
86
-
87
-
88
-
89
-
90
-
91
-
92
-
93
-
94
-
95
-
96
-
97
-
98
-
99
-
100
-
101
-
102
-
103
-
104
-
105
-
106
-
107
-
108
-
109
-
110
-
111
-
112
-
113
-
114
-
115
-
116
-
117
-
118
-
119
-
120
-
121
-
122
-
123
-
124
-
125
-
126
-
127
-
128
-
129
-
130
-
131
-
132
-
133
-
134
-
135
-
136
-
137
-
138
-
139
-
140
-
141
-
142
-
143
-
144
-
145
-
146
-
147
-
148
-
149
-
150
-
151
-
152
-
153
-
154
-
155
-
156
-
157
-
158
-
159
-
160
-
161
-
162
-
163
-
164
-
165
-
166
-
167
-
168
-
169
-
170
 |
 |

| Big Lots, Inc. 2014 Annual Report |
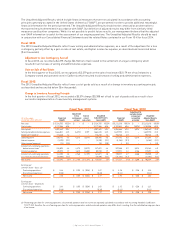
The Unaudited Adjusted Results, which include financial measures that are not calculated in accordance with accounting
principles generally accepted in the United States of America ("GAAP"), are presented in order to provide additional meaningful
financial information for the period presented. The Unaudited Adjusted Results should not be construed as an alternative to
the reported results determined in accordance with GAAP. Our definition of adjusted results may differ from similarly titled
measures used by other companies. While it is not possible to predict future results, our management believes that the adjusted
non-GAAP information is useful for the assessment of our ongoing operations. The Unaudited Adjusted Results should be read
in conjunction with our Consolidated Financial Statements and the related Notes contained in our Form 10-K for fiscal 2014.
Fiscal 2013
The 2013 Unaudited Adjusted Results reflect lower selling and administrative expenses, as a result of the adjustment for a loss
contingency partially offset by a gain on sale of real estate, and higher income tax expense, as described and reconciled below
($ in thousands):
Adjustment to Loss Contingency Accrual
In fiscal 2013, we recorded a $4,375 charge ($2,760 net of tax) related to the settlement of a legal contingency which
resulted in an increase of selling and administrative expenses.
Gain on Sale of Real Estate
In the third quarter of fiscal 2013, we recognized a $3,579 gain on the sale of real estate ($2,179 net of tax) related to a
Company-owned and operated store in California which resulted in a decrease of selling and administrative expenses.
Fiscal 2012
The 2012 Unaudited Adjusted Results reflect lower cost of goods sold as a result of a change in inventory accounting principle,
as described and reconciled below ($ in thousands):
Change in Inventory Accounting Principle
In the first quarter of fiscal 2012, we recorded a $5,574 charge ($3,388 net of tax) to cost of goods sold as a result of our
successful implementation of new inventory management systems.
Net sales $ 5,124,755 100.0% $ – $ – $ 5,124,755 100.0% $ 5,212,318 100.0% $ – $ 5,212,318 100.0%
Cost of sales 3,117,386 60.8 – – 3,117,386 60.8 3,157,632 60.6 (5,574) 3,152,058 60.5
Gross profit 2,007,369 39.2 – – 2,007,369 39.2 2,054,686 39.4 5,574 2,060,260 39.5
Selling and administrative expenses 1,664,031 32.5 (4,375) 3,579 1,663,235 32.5 1,639,770 31.5 – 1,639,770 31.5
Depreciation expense 113,228 2.2 – – 113,228 2.2 103,146 2.0 – 103,146 2.0
Operating profit 230,110 4.5 4,375 (3,579) 230,906 4.5 311,770 6.0 5,574 317,344 6.1
Interest expense (3,293) (0.1) – – (3,293) (0.1) (4,184) ( 0.1) – (4,184) (0.1)
Other income (expense) (12) (0.0) – – (12) (0.0) 2 0.0 – 2 0.0
Income from continuing operations
before income taxes 226,805 4.4 4,375 (3,579) 227,601 4.4 307,588 5.9 5,574 313,162 6.0
Income tax expense 85,515 1.7 1,615 (1,400 ) 85,730 1.7 117,071 2.2 2,186 119,257 2.3
Income from continuing operations 141,290 2.8 2,760 (2,179) 141,871 2.8 190,517 3.7 3,388 193,905 3.7
Loss from discontinued operations (15,995) (0.3) – – (15,995) (0.3) (13,396) (0.3) – (13,396) (0.3)
Net income $ 125,295 2.4% $ 2,760 $ (2,179) $ 125,876 2.5% $ 177,121 3.4% $ 3,388 $ 180,509 3.5%
Earnings per
common share - basic:
(h)
Continuing operations $ 2.46 $ 0.05 $ (0.04) $ 2.47 $ 3.18 $ 0.06 $ 3.24
Discontinued operations (0.28) – – (0.28) (0.22) – (0.22)
Net income $ 2.18 $ 0.05 $ (0.04) $ 2.19 $ 2.96 $ 0.06 $ 3.02
Earnings per
common share - diluted:
(h)
Continuing operations $ 2.44 $ 0.05 $ (0.04) $ 2.45 $ 3.15 $ 0.06 $ 3.21
Discontinued operations (0.28) – – (0.28) (0.22) – (0.22)
Net income $ 2.16 $ 0.05 $ (0.04) $ 2.17 $ 2.93 $ 0.06 $ 2.98
Fiscal Year 2013 Fiscal Year 2012
Adjustment to
exclude change
in inventory
accounting
principle
Reported
(GAAP)
Unaudited
Adjusted Results
(non-GAAP)
Unaudited
Adjusted Results
(non-GAAP)
Reported
(GAAP)
Adjustment
to loss
contingency
accrual
Gain on
sale of
real estate
($ in thousands,
except per share amounts)
(h) The earnings per share for continuing operations, discontinued operations and net income are separately calculated in accordance with Accounting Standards Codification
("ASC") 260; therefore, the sum of earnings per share for continuing operations and discontinued operations may differ, due to rounding, from the calculated earnings per share
of net income.