Big Lots 2014 Annual Report Download - page 6
Download and view the complete annual report
Please find page 6 of the 2014 Big Lots annual report below. You can navigate through the pages in the report by either clicking on the pages listed below, or by using the keyword search tool below to find specific information within the annual report.-
 1
1 -
 2
2 -
 3
3 -
 4
4 -
 5
5 -
 6
6 -
 7
7 -
 8
8 -
 9
9 -
 10
10 -
 11
11 -
 12
12 -
 13
13 -
 14
14 -
 15
15 -
 16
16 -
 17
17 -
18
-
19
-
20
-
21
-
22
-
23
-
24
-
25
-
26
-
27
-
28
-
29
-
30
-
31
-
32
-
33
-
34
-
35
-
36
-
37
-
38
-
39
-
40
-
41
-
42
-
43
-
44
-
45
-
46
-
47
-
48
-
49
-
50
-
51
-
52
-
53
-
54
-
55
-
56
-
57
-
58
-
59
-
60
-
61
-
62
-
63
-
64
-
65
-
66
-
67
-
68
-
69
-
70
-
71
-
72
-
73
-
74
-
75
-
76
-
77
-
78
-
79
-
80
-
81
-
82
-
83
-
84
-
85
-
86
-
87
-
88
-
89
-
90
-
91
-
92
-
93
-
94
-
95
-
96
-
97
-
98
-
99
-
100
-
101
-
102
-
103
-
104
-
105
-
106
-
107
-
108
-
109
-
110
-
111
-
112
-
113
-
114
-
115
-
116
-
117
-
118
-
119
-
120
-
121
-
122
-
123
-
124
-
125
-
126
-
127
-
128
-
129
-
130
-
131
-
132
-
133
-
134
-
135
-
136
-
137
-
138
-
139
-
140
-
141
-
142
-
143
-
144
-
145
-
146
-
147
-
148
-
149
-
150
-
151
-
152
-
153
-
154
-
155
-
156
-
157
-
158
-
159
-
160
-
161
-
162
-
163
-
164
-
165
-
166
-
167
-
168
-
169
-
170
 |
 |

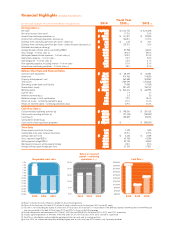
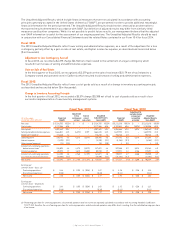
Cash flow
(f)
Fiscal Year
($ in thousands, except per share amounts and sales per selling square foot) 2 014 2 013 (a) 2012 (a)
Earnings Data (b)
N
et sales $ 5,177,078 $ 5,124,755 $ 5,212,318
Net sales increase (decrease) 1.0% (1.7)% 2.3%
Income from continuing operations
(c)
$ 136,661 $ 141,871 $ 193,905
Income from continuing operations decrease
(c)
(3.7)% (26.8)% (11.7)%
Earnings from continuing operations per share - diluted
(c)
$ 2.46 $ 2.45 $ 3.21
Earnings from continuing operations per share - diluted increase (decrease)
(c)
0.4% (23.7)% 1.6%
Dividends declared per share
(g)
$ 0.51 – –
Average diluted common shares outstanding (000's) 55,552 57,958 60,476
Gross margin - % of net sales
(c)
39.5% 39.2% 39.5%
Selling and administrative expenses - % of net sales
(c)
32.8% 32.5% 31.5%
Depreciation expense - % of net sales 2.3% 2.2% 2.0%
Operating profit - % of net sales
(c)
4.3% 4.5% 6.1%
Non-operating expense, including interest - % of net sales (0.0)% 0.1% 0.1%
Income from continuing operations - % of net sales
(c)
2.6% 2.8% 3.7%
Balance Sheet Data and Financial Ratios
Cash and cash equivalents $ 52,261 $ 68,629 $ 60,581
Inventories 851,669 914,965 918,023
Property and equipment - net 550,555 569,682 593,562
Total assets 1,635,891 1,739,599 1,753,626
Borrowings under bank credit facility 62,100 77,000 171,200
Shareholders’ equity 789,550 901,427 758,142
Working capital $ 450,600 $ 543,614 $ 460,996
Current ratio 1.8 1.9 1.7
Inventory turnover
(b)(c)
3.5 3.3 3.5
Bank borrowings to total capitalization 7.3% 7.9% 18.4%
Return on assets - continuing operations
(b)(c)
8.1% 8.1% 11.4%
Return on invested capital - continuing operations
(b)(c)
14.9% 14.9% 21.3%
Cash Flow Data
(b)
Cash provided by operating activities
(d)
$ 318,562 $ 198,334 $ 281,133
Cash used in investing activities
(e)
(90,749) (97,495) (130,357)
Cash flow
(f)
227,813 100,839 150,776
Cash paid for dividends
(g)
(27,828) – –
Cash used in share repurchase programs $ (250,000) $ – $ (298,501)
Store Data
Stores open at end of the fiscal year 1,460 1,493 1,495
Comparable store sales increase (decrease) 1.8% (2.7)% (2.7)%
Average sales per store $ 3,506 $ 3,430 $ 3,539
Gross square footage (000's) 45,134 45,708 45,505
Selling square footage (000's) 32,006 32,732 32,623
(Decrease) increase in selling square footage (2.2)% 0.3% 3.5%
Average selling square footage per store 21,922 21,924 21,821
2.5%
2.0%
1.5%
1.0%
0.5%
0.0%
(0.5)%
(1.0)%
(1.5)%
(2.0)%
(2.5)%
(3.0)%
(3.5)%
Financial Highlights
(Unaudited Adjusted Results)
(a) Recast to classify the results of Big Lots Canada into discontinued operations.
(b) The results for fiscal year 2014 and 2013 include 52 weeks, while the results for fiscal year 2012 include 53 weeks.
(c) This item is shown excluding the impact of certain items for fiscal years 2013 and 2012. A reconciliation of the difference between GAAP and the non-GAAP financial
measures presented in this table for fiscal years 2013 and 2012 is shown on the following page.
(d) Includes depreciation and amortization of $105,849, $102,196, and $95,602 for fiscal years 2014, 2013, and 2012, respectively.
(e) Includes capital expenditures of $93,460, $104,786, and $131,273 for fiscal years 2014, 2013, and 2012, respectively.
(f) Cash flow is calculated as cash provided by operating activities less cash used in investing activities.
(g) In June 2014, we commenced a quarterly dividend program and, as such, fiscal year 2014 contains only 3 quarterly dividends.
Comparable store sales
Return on invested
capital – continuing
operations
(b)(c)
25.0%
20.0%
15.0%
10.0%
5.0%
0.0%
$250,000
$230,000
$210,000
$190,000
$170,000
$150,000
$130,000
$110,000
$90,000
$70,000
$50,000
2 014 2 013 2 012 2 014 2 013 2 012 2 014 2 013 2 012
14.9%
1.8%
(2.7)% (2.7)%
14.9%
21.3% $227,813
$100,839
$150,776