Big Lots 2007 Annual Report Download - page 6
Download and view the complete annual report
Please find page 6 of the 2007 Big Lots annual report below. You can navigate through the pages in the report by either clicking on the pages listed below, or by using the keyword search tool below to find specific information within the annual report.-
 1
1 -
 2
2 -
 3
3 -
 4
4 -
 5
5 -
 6
6 -
 7
7 -
 8
8 -
 9
9 -
 10
10 -
 11
11 -
 12
12 -
 13
13 -
 14
14 -
 15
15 -
 16
16 -
 17
17 -
18
-
19
-
20
-
21
-
22
-
23
-
24
-
25
-
26
-
27
-
28
-
29
-
30
-
31
-
32
-
33
-
34
-
35
-
36
-
37
-
38
-
39
-
40
-
41
-
42
-
43
-
44
-
45
-
46
-
47
-
48
-
49
-
50
-
51
-
52
-
53
-
54
-
55
-
56
-
57
-
58
-
59
-
60
-
61
-
62
-
63
-
64
-
65
-
66
-
67
-
68
-
69
-
70
-
71
-
72
-
73
-
74
-
75
-
76
-
77
-
78
-
79
-
80
-
81
-
82
-
83
-
84
-
85
-
86
-
87
-
88
-
89
-
90
-
91
-
92
-
93
-
94
-
95
-
96
-
97
-
98
-
99
-
100
-
101
-
102
-
103
-
104
-
105
-
106
-
107
-
108
-
109
-
110
-
111
-
112
-
113
-
114
-
115
-
116
-
117
-
118
-
119
-
120
-
121
-
122
-
123
-
124
-
125
-
126
-
127
-
128
-
129
-
130
-
131
-
132
-
133
-
134
-
135
-
136
-
137
-
138
-
139
-
140
-
141
-
142
-
143
-
144
-
145
-
146
-
147
-
148
-
149
-
150
-
151
-
152
-
153
-
154
-
155
-
156
-
157
-
158
-
159
-
160
-
161
-
162
-
163
-
164
-
165
-
166
-
167
-
168
-
169
-
170
-
171
-
172
-
173
-
174
-
175
-
176
-
177
-
178
-
179
-
180
 |
 |

—
We experienced better markup, actively worked with
our vendors to increase the amount of pre-ticketed
and pre-packed goods to lower labor costs, and
continued to improve our inventory turnover.
—
Our store level and distribution center productivity
measurements were at all-time highs and our
transportation and healthcare initiatives saved millions
of dollars that went straight to the bottom line.
—
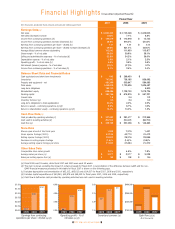
We improved our operating profi t rate by 140*
basis points compared to last year due to comp
store sales growth of 2% and signifi cant leverage
in SG&A expense.
—
We generated nearly $250 million of cash fl ow
based on the strength of our operations and our
diligent investment approach to inventory and
capital expenditures.
—
We repurchased 30 million shares of stock, signaling
confi dence in our future while returning cash to our
shareholders. Over the past 2 years, we have reinvested
over $850 million in our share repurchase activities,
with the majority of that investment coming from cash
generated by the business.
—
Bottom line — we drove record EPS from continuing operations of $1.41* during 2007, a 40% increase
over 2006 with this level of improvement viewed by many as one of the best performances in retail.
And we did all of this while continuing to invest in our business.
—
We completed our store retrofi t program, totaling 70 stores principally in California. The retrofi ts
enabled us to generate better sales, get more merchandise out on the selling fl oor, and move to a store
layout that does a better job of allocating square footage to key categories that are relevant to the
individual store. Including new stores and some tests in 2006, we have completed this process in
about 100 stores, and we will continue to invest in this type of activity where we see the opportunity for
profi table growth.
—
In 2007, we installed a new point-of-sale system in over half of our fl eet, with the remaining stores to
be completed in 2008. We believe this investment will increase productivity at checkout, enhance the
customer experience, and aid us in making better purchasing, allocation and replenishment decisions.
—
And in January 2008, we entered into a contract with SAP to improve our core IT infrastructure with the
implementation of new fi nancial and core merchandising systems. This is another multiyear project that
invests in our business for the long term.
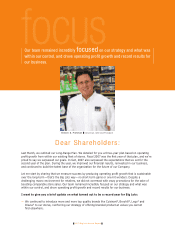
It’s clear that great companies fi nd a way to consistently meet challenging expectations, developing a track
record of reliability in the process. We focus on this at Big Lots. Since my fi rst day here, we said we were
going to manage this business for the long-term. That’s what we’ve done and will continue to do, even when
the landscape is diffi cult. Over the last two years, we’ve examined almost every aspect of our business, from
merchandising and merchandise processes to marketing, real estate and the cost structure of the business.
As we have worked to improve our business, we have made a couple of key observations. First, our concept
can be successful in a wide variety of locations, regions and demographic markets.
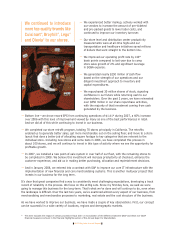
We continued to introduce
more top quality brands like
Cuisinart®
, Broyhill®, Lego®
and Olevia® to our stores.
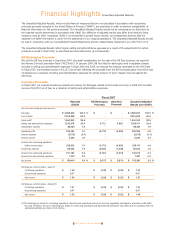
* This item excludes the impact of certain proceeds in fi scal 2007. A reconciliation of the difference between GAAP and these non-GAAP
fi nancial measures is shown in the Financial Highlights section of this Annual Report to Shareholders.
2007 Big Lots Annual Report