Best Buy 2000 Annual Report Download - page 43
Download and view the complete annual report
Please find page 43 of the 2000 Best Buy annual report below. You can navigate through the pages in the report by either clicking on the pages listed below, or by using the keyword search tool below to find specific information within the annual report.-
 1
1 -
2
-
3
-
4
-
5
-
6
-
7
-
8
-
9
-
10
-
11
-
12
-
13
-
14
-
15
-
16
-
17
-
18
-
19
-
20
-
21
-
22
-
23
-
24
-
25
-
26
-
27
-
28
-
29
-
30
-
31
-
32
-
 33
33 -
 34
34 -
 35
35 -
 36
36 -
 37
37 -
 38
38 -
 39
39 -
 40
40 -
 41
41 -
 42
42 -
 43
43 -
 44
44 -
 45
45 -
 46
46 -
 47
47 -
 48
48 -
 49
49 -
 50
50 -
 51
51 -
 52
52
 |
 |

41
$ in thousands, except per share amounts
Best Buy Co., Inc. Fiscal 2000 Annual Report
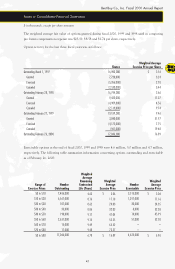
The weighted average fair value of options granted during fiscal 2000, 1999 and 1998 used in computing
pro forma compensation expense was $25.59, $8.58 and $1.74 per share, respectively.
Option activity for the last three fiscal years was as follows:
Weighted Average
Shares Exercise Price per Share
Outstanding March 1, 1997 16,900,000 $ 3.54
Granted 7,720,000 3.24
Exercised (5,356,000) 2.78
Canceled (2,520,000) 3.44
Outstanding February 28, 1998 16,744,000 3.66
Granted 9,423,000 17.27
Exercised (4,909,000) 4.56
Canceled (2,119,000) 9.74
Outstanding February 27, 1999 19,139,000 9.46
Granted 3,040,000 51.97
Exercised (4,172,000) 7.75
Canceled (961,000) 19.48
Outstanding February 26, 2000 17,046,000 16.89
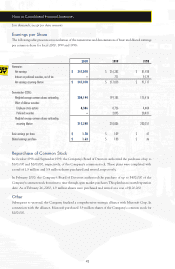
Exercisable options at the end of fiscal 2000, 1999 and 1998 were 4.6 million, 5.0 million and 4.7 million,
respectively. The following table summarizes information concerning options outstanding and exercisable
as of February 26, 2000:
Weighted
Average
Remaining Weighted Weighted
Range of Number Contractual Average Number Average
Exercise Prices Outstanding Life (Years) Exercise Price Exercisable Exercise Price
$0 to $10 7,486,000 4.63 $3.06 3,515,000 $ 3.04
$10 to $20 6,567,000 8.16 17.18 1,017,000 17.16
$20 to $30 107,000 8.62 24.03 20,000 24.35
$30 to $40 33,000 8.86 32.03 8,000 32.03
$40 to $50 190,000 9.17 47.04 14,000 45.99
$50 to $60 2,631,000 9.15 52.25 51,000 52.58
$60 to $70 15,000 9.49 65.52 ––
$70 to $80 17,000 9.48 73.27 – –
$0 to $80 17,046,000 6.78 $ 16.89 4,625,000 $ 6.96
Notes to Consolidated Financial Statements