Best Buy 2000 Annual Report Download - page 34
Download and view the complete annual report
Please find page 34 of the 2000 Best Buy annual report below. You can navigate through the pages in the report by either clicking on the pages listed below, or by using the keyword search tool below to find specific information within the annual report.-
 1
1 -
2
-
3
-
4
-
5
-
6
-
7
-
8
-
9
-
10
-
11
-
12
-
13
-
14
-
15
-
16
-
17
-
18
-
19
-
20
-
21
-
22
-
23
-
 24
24 -
 25
25 -
 26
26 -
 27
27 -
 28
28 -
 29
29 -
 30
30 -
 31
31 -
 32
32 -
 33
33 -
 34
34 -
 35
35 -
 36
36 -
 37
37 -
 38
38 -
 39
39 -
 40
40 -
 41
41 -
 42
42 -
 43
43 -
 44
44 -
45
-
46
-
47
-
48
-
49
-
50
-
51
-
52
 |
 |

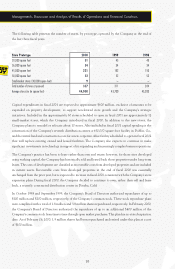
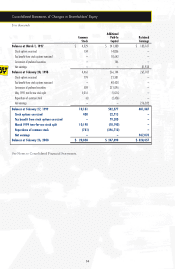
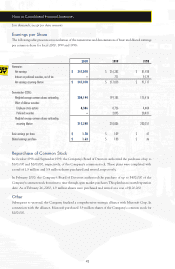
32
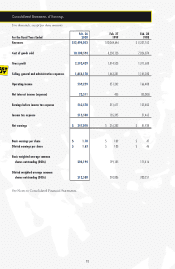
$ in thousands, except per share amounts
Feb. 26 Feb. 27 Feb. 28
For the Fiscal Years Ended 2000 1999 1998
Revenues $12,494,023 $10,064,646 $ 8,337,762
Cost of goods sold 10,100,594 8,250,123 7,026,074
Gross profit 2,393,429 1,814,523 1,311,688
Selling, general and administrative expenses 1,854,170 1,463,281 1,145,280
Operating income 539,259 351,242 166,408
Net interest income (expense) 23,311 435 (33,005)
Earnings before income tax expense 562,570 351,677 133,403
Income tax expense 215,500 135,395 51,465
Net earnings $ 347,070 $ 216,282 $ 81,938
Basic earnings per share $ 1.70 $ 1.09 $ .47
Diluted earnings per share $ 1.63 $ 1.03 $ .46
Basic weighted average common
shares outstanding (000s) 204,194 199,185 175,416
Diluted weighted average common
shares outstanding (000s) 212,580 210,006 200,251
See Notes to Consolidated Financial Statements.
Consolidated Statements of Earnings