Best Buy 2000 Annual Report Download - page 36
Download and view the complete annual report
Please find page 36 of the 2000 Best Buy annual report below. You can navigate through the pages in the report by either clicking on the pages listed below, or by using the keyword search tool below to find specific information within the annual report.-
 1
1 -
2
-
3
-
4
-
5
-
6
-
7
-
8
-
9
-
10
-
11
-
12
-
13
-
14
-
15
-
16
-
17
-
18
-
19
-
20
-
21
-
22
-
23
-
24
-
25
-
 26
26 -
 27
27 -
 28
28 -
 29
29 -
 30
30 -
 31
31 -
 32
32 -
 33
33 -
 34
34 -
 35
35 -
 36
36 -
 37
37 -
 38
38 -
 39
39 -
 40
40 -
 41
41 -
 42
42 -
 43
43 -
 44
44 -
 45
45 -
 46
46 -
47
-
48
-
49
-
50
-
51
-
52
 |
 |

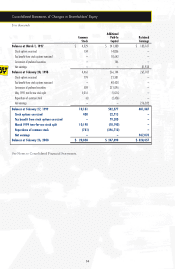
34
$ in thousands
Additional
Common Paid-In Retained
Stock Capital Earnings
Balances at March 1, 1997 $ 4,329 $ 241,300 $ 183,167
Stock options exercised 134 14,056 –
Tax benefit from stock options exercised – 10,642 –
Conversion of preferred securities – 146 –
Net earnings – – 81,938
Balances at February 28, 1998 4,463 266,144 265,105
Stock options exercised 199 21,381 –
Tax benefit from stock options exercised – 40,428 –
Conversion of preferred securities 509 221,896 –
May 1998 two-for-one stock split 5,016 (5,016) –
Repurchase of common stock (6) (2,456) –
Net earnings – – 216,282
Balances at February 27, 1999 10,181 542,377 481,387
Stock options exercised 408 32,713 –
Tax benefit from stock options exercised – 79,300 –
March 1999 two-for-one stock split 10,190 (10,190) –
Repurchase of common stock (741) (396,710) –
Net earnings – – 347,070
Balances at February 26, 2000 $ 20,038 $ 247,490 $ 828,457
See Notes to Consolidated Financial Statements.
Consolidated Statements of Changes in Shareholders’ Equity