Berkshire Hathaway 2015 Annual Report Download - page 93
Download and view the complete annual report
Please find page 93 of the 2015 Berkshire Hathaway annual report below. You can navigate through the pages in the report by either clicking on the pages listed below, or by using the keyword search tool below to find specific information within the annual report.-
 1
1 -
2
-
3
-
4
-
5
-
6
-
7
-
8
-
9
-
10
-
11
-
12
-
13
-
14
-
15
-
16
-
17
-
18
-
19
-
20
-
21
-
22
-
23
-
24
-
25
-
26
-
27
-
28
-
29
-
30
-
31
-
32
-
33
-
34
-
35
-
36
-
37
-
38
-
39
-
40
-
41
-
42
-
43
-
44
-
45
-
46
-
47
-
48
-
49
-
50
-
51
-
52
-
53
-
54
-
55
-
56
-
57
-
58
-
59
-
60
-
61
-
62
-
63
-
64
-
65
-
66
-
67
-
68
-
69
-
70
-
71
-
72
-
73
-
74
-
75
-
76
-
77
-
78
-
79
-
80
-
81
-
82
-
 83
83 -
 84
84 -
 85
85 -
 86
86 -
 87
87 -
 88
88 -
 89
89 -
 90
90 -
 91
91 -
 92
92 -
 93
93 -
 94
94 -
 95
95 -
 96
96 -
 97
97 -
 98
98 -
 99
99 -
 100
100 -
 101
101 -
 102
102 -
 103
103 -
104
-
105
-
106
-
107
-
108
-
109
-
110
-
111
-
112
-
113
-
114
-
115
-
116
-
117
-
118
-
119
-
120
-
121
-
122
-
123
-
124
 |
 |

Management’s Discussion and Analysis (Continued)
Manufacturing, Service and Retailing (Continued)
McLane Company (Continued)
Revenues in 2014 increased $710 million (1.5%) compared to 2013, primarily due to revenue increases in the foodservice
unit (7%) and beverage unit (11%). Pre-tax earnings in 2014 declined $51 million (10.5%) from 2013. Earnings in 2013
included a pre-tax gain of $24 million from the sale of a logistics business. Before the impact of this gain, earnings decreased
6% compared to 2013. The decline reflected slightly higher earnings from the grocery unit and beverage unit, which were more
than offset by lower earnings from the foodservice unit. In 2014, our foodservice unit experienced higher processing costs and
higher other operating costs which more than offset the increase in revenues.
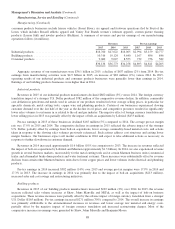
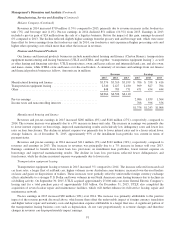
Finance and Financial Products
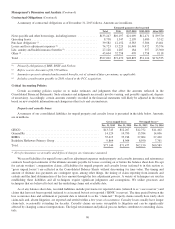
Our finance and financial products businesses include manufactured housing and finance (Clayton Homes), transportation
equipment manufacturing and leasing businesses (UTLX and XTRA, and together, “transportation equipment leasing”), as well
as other leasing and financing activities. UTLX manufactures, owns and leases railcars and intermodal tank cars, and also owns
and leases cranes, while XTRA owns and leases over-the-road trailers. A summary of revenues and earnings from our finance
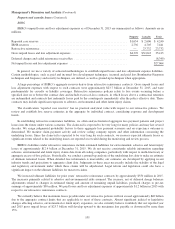
and financial products businesses follows. Amounts are in millions.
Revenues Earnings
2015 2014 2013 2015 2014 2013
Manufactured housing and finance .............................. $3,576 $3,310 $3,199 $ 706 $ 558 $ 416
Transportation equipment leasing ............................... 2,540 2,427 2,180 909 827 704
Other ..................................................... 848 789 731 471 454 444
$6,964 $6,526 $6,110
Pre-tax earnings ............................................. 2,086 1,839 1,564
Income taxes and noncontrolling interests ........................ 708 596 556
$1,378 $1,243 $1,008
Manufactured housing and finance
Revenues and pre-tax earnings in 2015 increased $266 million (8%) and $148 million (27%), respectively, compared to
2014. The revenue increase was primarily due to a 9% increase in home unit sales. The increase in earnings was primarily due
to lower interest expense on borrowings, improved manufacturing results and relatively low delinquency rates and lower loss
rates on loan foreclosures. The decline in interest expense was primarily due to lower interest rates and to a lesser extent lower
average balances. As of December 31, 2015, approximately 95% of the installment loan portfolio was current in terms of
payment status.
Revenues and pre-tax earnings in 2014 increased $111 million (3%) and $142 million (34%), respectively, compared to
revenues and earnings in 2013. The increase in revenues was principally due to a 7% increase in homes sold over 2013.
Earnings continued to benefit from lower loan loss provisions on installment loan portfolios, lower interest expense on
borrowings and improved manufacturing results. The decline in loan loss provisions reflected fewer delinquencies and
foreclosures, while the decline in interest expense was primarily due to lower rates.
Transportation equipment leasing
Transportation equipment leasing revenues in 2015 increased 5% compared to 2014. The increase reflected increased rail
car lease rates, a larger fleet of rail/tank cars, higher volumes in our Australian crane business, increased over-the-road trailers
on lease and gains on dispositions of trailers. These increases were partially offset by unfavorable foreign currency exchange
effects attributable to a stronger U.S. Dollar and lower volumes in our North American crane leasing business due to declines in
oil drilling activity. On September 30, 2015, UTLX acquired approximately 25,000 tank cars from General Electric Company’s
leasing unit for a total purchase price of approximately $1.0 billion. On December 31, 2015, UTLX also completed the
acquisition of several railcar repair and maintenance facilities, which will further enhance its full-service leasing, repair and
maintenance network.
Pre-tax earnings in 2015 increased $82 million (10%) over 2014. The increase was primarily attributable to the positive
impact of the revenue growth discussed above, which more than offset the unfavorable impact of foreign currency translation
and higher railcar repair and warranty costs and depreciation expense attributable to a larger fleet size. A significant portion of
the transportation leasing business costs such as depreciation, do not vary proportionately to revenue changes and therefore
changes in revenues can disproportionately impact earnings.
91