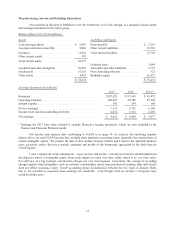
Berkshire Hathaway 2015 Annual Report Download - page 18
Download and view the complete annual report
Please find page 18 of the 2015 Berkshire Hathaway annual report below. You can navigate through the pages in the report by either clicking on the pages listed below, or by using the keyword search tool below to find specific information within the annual report.-
 1
1 -
2
-
3
-
4
-
5
-
6
-
7
-
 8
8 -
 9
9 -
 10
10 -
 11
11 -
 12
12 -
 13
13 -
 14
14 -
 15
15 -
 16
16 -
 17
17 -
 18
18 -
 19
19 -
 20
20 -
 21
21 -
 22
22 -
 23
23 -
 24
24 -
 25
25 -
 26
26 -
 27
27 -
 28
28 -
29
-
30
-
31
-
32
-
33
-
34
-
35
-
36
-
37
-
38
-
39
-
40
-
41
-
42
-
43
-
44
-
45
-
46
-
47
-
48
-
49
-
50
-
51
-
52
-
53
-
54
-
55
-
56
-
57
-
58
-
59
-
60
-
61
-
62
-
63
-
64
-
65
-
66
-
67
-
68
-
69
-
70
-
71
-
72
-
73
-
74
-
75
-
76
-
77
-
78
-
79
-
80
-
81
-
82
-
83
-
84
-
85
-
86
-
87
-
88
-
89
-
90
-
91
-
92
-
93
-
94
-
95
-
96
-
97
-
98
-
99
-
100
-
101
-
102
-
103
-
104
-
105
-
106
-
107
-
108
-
109
-
110
-
111
-
112
-
113
-
114
-
115
-
116
-
117
-
118
-
119
-
120
-
121
-
122
-
123
-
124
 |
 |
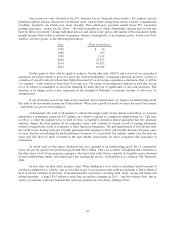
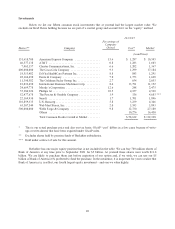
In the GAAP-compliant figures we show on page 38, amortization charges of $1.1 billion have been
deducted as expenses. We would call about 20% of these “real,” the rest not. The “non-real” charges, once non-
existent at Berkshire, have become significant because of the many acquisitions we have made. Non-real
amortization charges are likely to climb further as we acquire more companies.
The table on page 55 gives you the current status of our intangible assets as calculated by GAAP. We now
have $6.8 billion left of amortizable intangibles, of which $4.1 billion will be expensed over the next five years.
Eventually, of course, every dollar of these “assets” will be charged off. When that happens, reported earnings
increase even if true earnings are flat. (My gift to my successor.)
I suggest that you ignore a portion of GAAP amortization costs. But it is with some trepidation that I do
that, knowing that it has become common for managers to tell their owners to ignore certain expense items that are
all too real. “Stock-based compensation” is the most egregious example. The very name says it all: “compensation.”
If compensation isn’t an expense, what is it? And, if real and recurring expenses don’t belong in the calculation of
earnings, where in the world do they belong?
Wall Street analysts often play their part in this charade, too, parroting the phony, compensation-ignoring
“earnings” figures fed them by managements. Maybe the offending analysts don’t know any better. Or maybe they
fear losing “access” to management. Or maybe they are cynical, telling themselves that since everyone else is
playing the game, why shouldn’t they go along with it. Whatever their reasoning, these analysts are guilty of
propagating misleading numbers that can deceive investors.
Depreciation charges are a more complicated subject but are almost always true costs. Certainly they are at
Berkshire. I wish we could keep our businesses competitive while spending less than our depreciation charge, but in
51 years I’ve yet to figure out how to do so. Indeed, the depreciation charge we record in our railroad business falls
far short of the capital outlays needed to merely keep the railroad running properly, a mismatch that leads to GAAP
earnings that are higher than true economic earnings. (This overstatement of earnings exists at all railroads.) When
CEOs or investment bankers tout pre-depreciation figures such as EBITDA as a valuation guide, watch their noses
lengthen while they speak.
Our public reports of earnings will, of course, continue to conform to GAAP. To embrace reality, however,
you should remember to add back most of the amortization charges we report. You should also subtract something
to reflect BNSF’s inadequate depreciation charge.
************
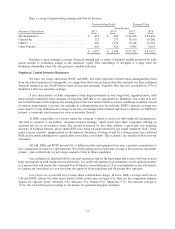
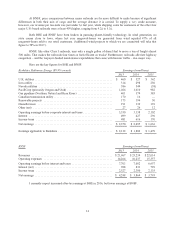
Let’s get back to our many manufacturing, service and retailing operations, which sell products ranging
from lollipops to jet airplanes. Some of this sector’s businesses, measured by earnings on unleveraged net tangible
assets, enjoy terrific economics, producing profits that run from 25% after-tax to far more than 100%. Others
generate good returns in the area of 12% to 20%.
A few, however – these are serious mistakes I made in my job of capital allocation – have very poor
returns. In most of these cases, I was wrong in my evaluation of the economic dynamics of the company or the
industry in which it operates, and we are now paying the price for my misjudgments. At other times, I stumbled in
evaluating either the fidelity or the ability of incumbent managers or ones I later appointed. I will commit more
errors; you can count on that. If we luck out, they will occur at our smaller operations.
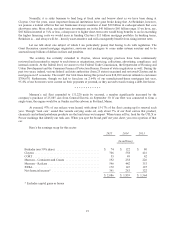
Viewed as a single entity, the companies in this group are an excellent business. They employed an average
of $25.6 billion of net tangible assets during 2015 and, despite their holding large quantities of excess cash and
using only token amounts of leverage, earned 18.4% after-tax on that capital.
16