Berkshire Hathaway 2009 Annual Report Download - page 65
Download and view the complete annual report
Please find page 65 of the 2009 Berkshire Hathaway annual report below. You can navigate through the pages in the report by either clicking on the pages listed below, or by using the keyword search tool below to find specific information within the annual report.-
 1
1 -
2
-
3
-
4
-
5
-
6
-
7
-
8
-
9
-
10
-
11
-
12
-
13
-
14
-
15
-
16
-
17
-
18
-
19
-
20
-
21
-
22
-
23
-
24
-
25
-
26
-
27
-
28
-
29
-
30
-
31
-
32
-
33
-
34
-
35
-
36
-
37
-
38
-
39
-
40
-
41
-
42
-
43
-
44
-
45
-
46
-
47
-
48
-
49
-
50
-
51
-
52
-
53
-
54
-
 55
55 -
 56
56 -
 57
57 -
 58
58 -
 59
59 -
 60
60 -
 61
61 -
 62
62 -
 63
63 -
 64
64 -
 65
65 -
 66
66 -
 67
67 -
 68
68 -
 69
69 -
 70
70 -
 71
71 -
 72
72 -
 73
73 -
 74
74 -
 75
75 -
76
-
77
-
78
-
79
-
80
-
81
-
82
-
83
-
84
-
85
-
86
-
87
-
88
-
89
-
90
-
91
-
92
-
93
-
94
-
95
-
96
-
97
-
98
-
99
-
100
 |
 |

Management’s Discussion (Continued)
Insurance—Underwriting (Continued)
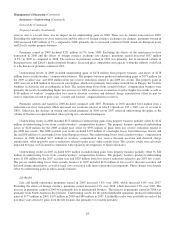
GEICO (Continued)
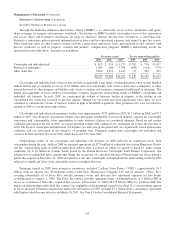
Premiums earned in 2009 increased $1,097 million (8.8%) over premiums earned in 2008, reflecting growth in voluntary
auto premiums earned as a result of an overall increase in policies-in-force of 7.8%. Policies-in-force grew more rapidly in the
latter part of 2008 and the early part of 2009 and moderated over the remainder of 2009. As a result, premiums earned in 2009
increased at a higher rate than policies-in-force, despite a slight decline in premiums per policy. Voluntary auto new business
sales in 2009 increased 9.0% versus 2008. Voluntary auto policies-in-force at December 31, 2009 were 684,000 greater than at
December 31, 2008.
Losses and loss adjustment expenses incurred in 2009 increased $1,125 million (12.1%) compared with 2008. The loss
ratio was 77.0% in 2009 compared to 74.8% in 2008. The higher loss ratio in 2009 reflected overall increases in average claim
frequencies and injury claim severities. Claims frequencies in 2009 for physical damage coverages increased in the one to two
percent range, while frequencies for injury coverages increased in the five to seven percent range compared with the very low
frequency levels in 2008. Average injury severities in 2009 increased in the three to five percent range while average physical
damage severities decreased in the two to four percent range from 2008. Incurred losses from catastrophe events in 2009 were
$83 million, relatively unchanged from 2008. Underwriting expenses in 2009 increased $239 million (10.7%) due primarily to
higher policy issuance costs and increased salary and employee benefit expenses, which included increased interest on deferred
compensation liabilities.
Premiums earned in 2008 increased 5.7% over 2007, reflecting an 8.2% increase in voluntary auto policies-in-force
partially offset by lower average premiums per policy. Average premiums per policy declined during 2007 but leveled off in
2008. Losses and loss adjustment expenses incurred in 2008 increased 9.5% over 2007. Incurred losses from catastrophe events
for 2008 were $87 million compared to $34 million for 2007. Overall, the increase in the loss ratio reflected higher average
claim severities and lower average premiums per policy, partially offset by lower average claims frequencies. Claims
frequencies in 2008 for physical damage coverages decreased in the seven to nine percent range from 2007 and frequencies for
injury coverages decreased in the four to six percent range. Physical damage severities in 2008 increased in the six to eight
percent range and injury severities increased in the five to eight percent range over 2007. Underwriting expenses in 2008
increased $61 million (2.8%) over 2007. Policy acquisition expenses increased 8.5% in 2008 to $1,508 million, primarily due to
increased advertising and policy issuance costs. The increase in policy acquisition expenses was partially offset by lower other
underwriting expenses, including lower interest on deferred compensation liabilities.
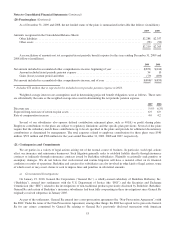
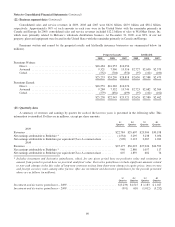
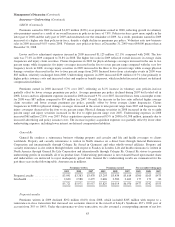
General Re
General Re conducts a reinsurance business offering property and casualty and life and health coverages to clients
worldwide. Property and casualty reinsurance is written in North America on a direct basis through General Reinsurance
Corporation and internationally through Cologne Re (based in Germany) and other wholly-owned affiliates. Property and
casualty reinsurance is also written through brokers with respect to Faraday in London. Life and health reinsurance is written in
North America through General Re Life Corporation and internationally through Cologne Re. General Re strives to generate
underwriting profits in essentially all of its product lines. Underwriting performance is not evaluated based upon market share
and underwriters are instructed to reject inadequately priced risks. General Re’s underwriting results are summarized for the
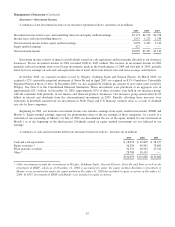
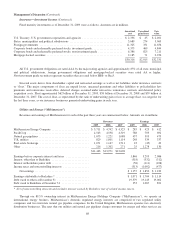
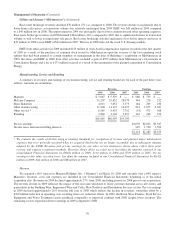
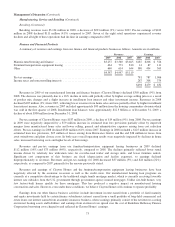
past three years in the following table. Amounts are in millions.
Premiums written Premiums earned Pre-tax underwriting gain
2009 2008 2007 2009 2008 2007 2009 2008 2007
Property/casualty ................. $3,091 $3,383 $3,478 $3,203 $3,434 $3,614 $300 $163 $475
Life/health ...................... 2,630 2,588 2,479 2,626 2,580 2,462 177 179 80
$5,721 $5,971 $5,957 $5,829 $6,014 $6,076 $477 $342 $555
Property/casualty
Premiums written in 2009 declined $292 million (8.6%) from 2008, which included $205 million with respect to a
reinsurance-to-close transaction that increased our economic interest in the run-off of Lloyd’s Syndicate 435’s 2000 year of
account from 39% to 100%. Under the reinsurance-to-close transaction, we also assumed a corresponding amount of net loss
63