Berkshire Hathaway 2009 Annual Report Download - page 45
Download and view the complete annual report
Please find page 45 of the 2009 Berkshire Hathaway annual report below. You can navigate through the pages in the report by either clicking on the pages listed below, or by using the keyword search tool below to find specific information within the annual report.-
 1
1 -
2
-
3
-
4
-
5
-
6
-
7
-
8
-
9
-
10
-
11
-
12
-
13
-
14
-
15
-
16
-
17
-
18
-
19
-
20
-
21
-
22
-
23
-
24
-
25
-
26
-
27
-
28
-
29
-
30
-
31
-
32
-
33
-
34
-
 35
35 -
 36
36 -
 37
37 -
 38
38 -
 39
39 -
 40
40 -
 41
41 -
 42
42 -
 43
43 -
 44
44 -
 45
45 -
 46
46 -
 47
47 -
 48
48 -
 49
49 -
 50
50 -
 51
51 -
 52
52 -
 53
53 -
 54
54 -
 55
55 -
56
-
57
-
58
-
59
-
60
-
61
-
62
-
63
-
64
-
65
-
66
-
67
-
68
-
69
-
70
-
71
-
72
-
73
-
74
-
75
-
76
-
77
-
78
-
79
-
80
-
81
-
82
-
83
-
84
-
85
-
86
-
87
-
88
-
89
-
90
-
91
-
92
-
93
-
94
-
95
-
96
-
97
-
98
-
99
-
100
 |
 |

Notes to Consolidated Financial Statements (Continued)
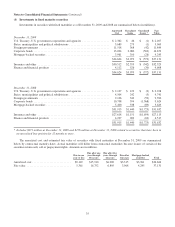
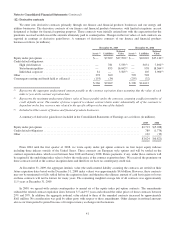
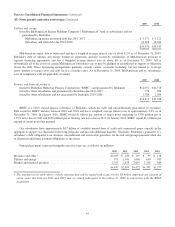
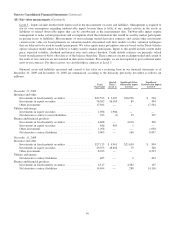
(13) Supplemental cash flow information
A summary of supplemental cash flow information for each of the three years ending December 31, 2009 is presented in
the following table (in millions).
2009 2008 2007
Cash paid during the year for:
Income taxes .................................................................. $2,032 $3,530 $5,895
Interest of finance and financial products businesses .................................. 622 537 569
Interest of utilities and energy businesses ........................................... 1,142 1,172 1,118
Interest of insurance and other businesses ........................................... 138 182 182
Non-cash investing and financing activities:
Investments received in connection with the Equitas reinsurance transaction ............... — — 6,529
Liabilities assumed in connection with acquisitions of businesses ........................ 278 4,763 612
Fixed maturity securities sold or redeemed offset by decrease in directly related repurchase
agreements ................................................................. — — 599
Equity/fixed maturity securities exchanged for other securities/investments ................ — 2,329 258
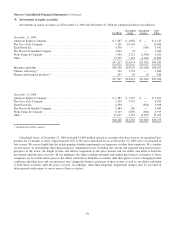
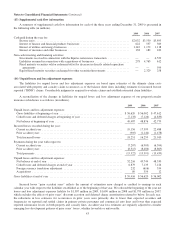
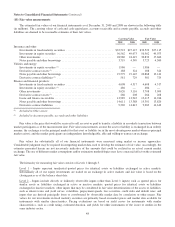
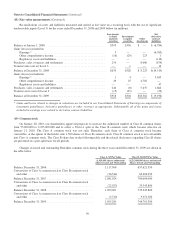
(14) Unpaid losses and loss adjustment expenses
The liabilities for unpaid losses and loss adjustment expenses are based upon estimates of the ultimate claim costs
associated with property and casualty claim occurrences as of the balance sheet dates including estimates for incurred but not
reported (“IBNR”) claims. Considerable judgment is required to evaluate claims and establish estimated claim liabilities.
A reconciliation of the changes in liabilities for unpaid losses and loss adjustment expenses of our property/casualty
insurance subsidiaries is as follows (in millions).
2009 2008 2007
Unpaid losses and loss adjustment expenses:
Gross liabilities at beginning of year ............................................ $56,620 $ 56,002 $ 47,612
Ceded losses and deferred charges at beginning of year ............................. (7,133) (7,126) (4,833)
Net balance at beginning of year ............................................... 49,487 48,876 42,779
Incurred losses recorded during the year:
Current accident year ........................................................ 19,156 17,399 22,488
Prior accident years ......................................................... (905) (1,140) (1,478)
Total incurred losses ........................................................ 18,251 16,259 21,010
Payments during the year with respect to:
Current accident year ........................................................ (7,207) (6,905) (6,594)
Prior accident years ......................................................... (8,315) (8,486) (8,865)
Total payments ............................................................. (15,522) (15,391) (15,459)
Unpaid losses and loss adjustment expenses:
Net balance at end of year .................................................... 52,216 49,744 48,330
Ceded losses and deferred charges at end of year .................................. 6,879 7,133 7,126
Foreign currency translation adjustment ......................................... 232 (616) 534
Acquisitions ............................................................... 89 359 12
Gross liabilities at end of year ................................................... $59,416 $ 56,620 $ 56,002
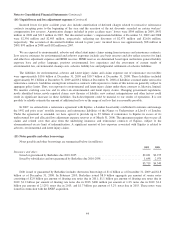
Incurred losses “prior accident years” reflects the amount of estimation error charged or credited to earnings in each
calendar year with respect to the liabilities established as of the beginning of that year. We reduced the beginning of the year net
losses and loss adjustment expenses liability by $1,507 million in 2009, $1,690 million in 2008 and $1,793 million in 2007,
which excludes the effects of prior years’ discount accretion and deferred charge amortization referred to below. In each year,
the reductions in loss estimates for occurrences in prior years were primarily due to lower than expected severities and
frequencies on reported and settled claims in primary private passenger and commercial auto lines and lower than expected
reported reinsurance losses in both property and casualty lines. Accident year loss estimates are regularly adjusted to consider
emerging loss development patterns of prior years’ losses, whether favorable or unfavorable.
43