Berkshire Hathaway 2009 Annual Report Download - page 63
Download and view the complete annual report
Please find page 63 of the 2009 Berkshire Hathaway annual report below. You can navigate through the pages in the report by either clicking on the pages listed below, or by using the keyword search tool below to find specific information within the annual report.-
 1
1 -
2
-
3
-
4
-
5
-
6
-
7
-
8
-
9
-
10
-
11
-
12
-
13
-
14
-
15
-
16
-
17
-
18
-
19
-
20
-
21
-
22
-
23
-
24
-
25
-
26
-
27
-
28
-
29
-
30
-
31
-
32
-
33
-
34
-
35
-
36
-
37
-
38
-
39
-
40
-
41
-
42
-
43
-
44
-
45
-
46
-
47
-
48
-
49
-
50
-
51
-
52
-
 53
53 -
 54
54 -
 55
55 -
 56
56 -
 57
57 -
 58
58 -
 59
59 -
 60
60 -
 61
61 -
 62
62 -
 63
63 -
 64
64 -
 65
65 -
 66
66 -
 67
67 -
 68
68 -
 69
69 -
 70
70 -
 71
71 -
 72
72 -
 73
73 -
74
-
75
-
76
-
77
-
78
-
79
-
80
-
81
-
82
-
83
-
84
-
85
-
86
-
87
-
88
-
89
-
90
-
91
-
92
-
93
-
94
-
95
-
96
-
97
-
98
-
99
-
100
 |
 |

BERKSHIRE HATHAWAY INC.
and Subsidiaries
Management’s Discussion and Analysis of
Financial Condition and Results of Operations
Results of Operations
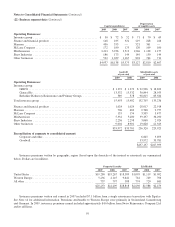
Net earnings attributable to Berkshire for each of the past three years are disaggregated in the table that follows. Amounts
are after deducting income taxes and exclude earnings attributable to noncontrolling interests. Amounts are in millions.
2009 2008 2007
Insurance – underwriting .......................................................... $1,013 $ 1,805 $ 2,184
Insurance – investment income ...................................................... 4,085 3,497 3,510
Utilities and energy ............................................................... 1,071 1,704 1,114
Manufacturing, service and retailing ................................................. 1,113 2,283 2,353
Finance and financial products ...................................................... 494 479 632
Other .......................................................................... (207) (129) (159)
Investment and derivative gains/losses ................................................ 486 (4,645) 3,579
Net earnings attributable to Berkshire ............................................ $8,055 $ 4,994 $13,213
Our operating businesses are managed on an unusually decentralized basis. There are essentially no centralized or
integrated business functions (such as sales, marketing, purchasing, legal or human resources) and there is minimal involvement
by our corporate headquarters in the day-to-day business activities of the operating businesses. Our senior corporate
management team does participate in and is ultimately responsible for significant capital allocation decisions, investment
activities and the selection of the Chief Executive to head each of the operating businesses. The business segment data (Note 22
to the Consolidated Financial Statements) should be read in conjunction with this discussion.
The declines in global economic activity over the last half of 2008 continued through 2009. Our operating results in 2009
were significantly impacted by those declines. Earnings in 2009 of most of our diverse group of manufacturing, service and
retailing businesses declined compared to the prior year. The effects from the economic recession resulted in lower sales
volume, revenues and profit margins as consumers have significantly curtailed spending, particularly for discretionary items.
Our two largest business segments, insurance and utilities, remain strong and operating results have not been negatively
impacted in any significant way by the recession. In 2008 and the first part of 2009, equity and debt markets experienced major
declines in market prices on a worldwide basis, which negatively impacted the fair value of our investments and derivative
contracts. While market prices recovered somewhat over the remainder of 2009, the potential for significant declines in our
investment values in the future remains.
We had after-tax net investment and derivative gains of $486 million in 2009, while in 2008 we had losses of $4.6 billion.
The gains and losses primarily derived from credit default contracts, dispositions of certain equity securities, other-than-
temporary impairment charges with respect to certain equity securities and changes in estimated fair values of long duration
equity index put option contracts. Changes in the equity and credit markets from period to period have caused and may continue
to cause significant volatility in our periodic earnings.
In response to the crises in the financial markets and the global recession, the U.S. government and governments around
the world are taking measures to stabilize financial institutions, regulate markets (including over-the-counter derivatives
markets) and stimulate economic activity. While we believe that general economic conditions will improve over time, the
ultimate impact of these actions on us is not clear at this time. Our operating companies have taken and will continue to take
cost reduction actions as necessary to manage through the current economic situation. We continue to believe that the economic
franchises of our operating businesses remain intact and that our operating results will ultimately improve, although we cannot
predict the timing of an economic recovery that will be required for this to occur.
Insurance—Underwriting
We engage in both primary insurance and reinsurance of property and casualty risks. In primary insurance activities, we
assume defined portions of the risks of loss from persons or organizations that are directly subject to the risks. In reinsurance
activities, we assume defined portions of similar or dissimilar risks that other insurers or reinsurers have subjected themselves to in
their own insuring activities. Our insurance and reinsurance businesses are: (1) GEICO, (2) General Re, (3) Berkshire Hathaway
Reinsurance Group and (4) Berkshire Hathaway Primary Group. Through General Re, we also reinsure life and health risks.
61