Berkshire Hathaway 2009 Annual Report Download - page 50
Download and view the complete annual report
Please find page 50 of the 2009 Berkshire Hathaway annual report below. You can navigate through the pages in the report by either clicking on the pages listed below, or by using the keyword search tool below to find specific information within the annual report.-
 1
1 -
2
-
3
-
4
-
5
-
6
-
7
-
8
-
9
-
10
-
11
-
12
-
13
-
14
-
15
-
16
-
17
-
18
-
19
-
20
-
21
-
22
-
23
-
24
-
25
-
26
-
27
-
28
-
29
-
30
-
31
-
32
-
33
-
34
-
35
-
36
-
37
-
38
-
39
-
 40
40 -
 41
41 -
 42
42 -
 43
43 -
 44
44 -
 45
45 -
 46
46 -
 47
47 -
 48
48 -
 49
49 -
 50
50 -
 51
51 -
 52
52 -
 53
53 -
 54
54 -
 55
55 -
 56
56 -
 57
57 -
 58
58 -
 59
59 -
 60
60 -
61
-
62
-
63
-
64
-
65
-
66
-
67
-
68
-
69
-
70
-
71
-
72
-
73
-
74
-
75
-
76
-
77
-
78
-
79
-
80
-
81
-
82
-
83
-
84
-
85
-
86
-
87
-
88
-
89
-
90
-
91
-
92
-
93
-
94
-
95
-
96
-
97
-
98
-
99
-
100
 |
 |

Notes to Consolidated Financial Statements (Continued)
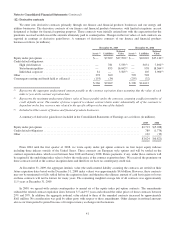
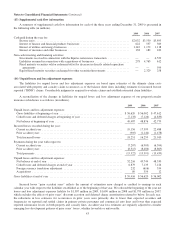
(18) Fair value measurements
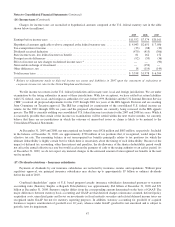
The estimated fair values of our financial instruments as of December 31, 2009 and 2008 are shown in the following table
(in millions). The carrying values of cash and cash equivalents, accounts receivable and accounts payable, accruals and other
liabilities are deemed to be reasonable estimates of their fair values.
Carrying Value Fair Value
2009 2008 2009 2008
Insurance and other:
Investments in fixed maturity securities ................................. $32,523 $27,115 $32,523 $27,115
Investments in equity securities ....................................... 56,562 49,073 56,562 49,073
Other investments .................................................. 28,980 18,419 30,832 17,660
Notes payable and other borrowings .................................... 3,719 4,349 3,723 4,300
Utilities and energy:
Investments in equity securities (1) ..................................... 1,986 — 1,986 —
Derivative contract assets (1) .......................................... 188 324 188 324
Notes payable and other borrowings .................................... 19,579 19,145 20,868 19,144
Derivative contract liabilities (2) ....................................... 581 729 581 729
Finance and financial products:
Investments in fixed maturity securities ................................. 4,608 4,517 4,608 4,517
Investments in equity securities (1) ..................................... 486 — 486 —
Other investments .................................................. 3,620 3,116 3,708 3,099
Derivative contract assets (1) .......................................... 266 208 266 208
Loans and finance receivables ......................................... 13,989 13,942 12,415 14,016
Notes payable and other borrowings .................................... 14,611 13,388 15,301 13,820
Derivative contract liabilities ......................................... 9,269 14,612 9,269 14,612
(1)Included in Other assets
(2) Included in Accounts payable, accruals and other liabilities
Fair value is the price that would be received to sell an asset or paid to transfer a liability in an orderly transaction between
market participants as of the measurement date. Fair value measurements assume the asset or liability is exchanged in an orderly
manner; the exchange is in the principal market for that asset or liability (or in the most advantageous market when no principal
market exists); and the market participants are independent, knowledgeable, able and willing to transact an exchange.
Fair values for substantially all of our financial instruments were measured using market or income approaches.
Considerable judgment may be required in interpreting market data used to develop the estimates of fair value. Accordingly, the
estimates presented herein are not necessarily indicative of the amounts that could be realized in an actual current market
exchange. The use of different market assumptions and/or estimation methodologies may have a material effect on the estimated
fair value.
The hierarchy for measuring fair value consists of Levels 1 through 3.
Level 1 – Inputs represent unadjusted quoted prices for identical assets or liabilities exchanged in active markets.
Substantially all of our equity investments are traded on an exchange in active markets and fair value is based on the
closing prices as of the balance sheet date.
Level 2 – Inputs include directly or indirectly observable inputs (other than Level 1 inputs) such as quoted prices for
similar assets or liabilities exchanged in active or inactive markets; quoted prices for identical assets or liabilities
exchanged in inactive markets; other inputs that may be considered in fair value determinations of the assets or liabilities,
such as interest rates and yield curves, volatilities, prepayment speeds, loss severities, credit risks and default rates; and
inputs that are derived principally from or corroborated by observable market data by correlation or other means. Fair
values for our investments in fixed maturity securities are primarily based on market prices and market data available for
instruments with similar characteristics. Pricing evaluations are based on yield curves for instruments with similar
characteristics, such as credit rating, estimated duration, and yields for other instruments of the issuer or entities in the
same industry sector.
48