Berkshire Hathaway 2008 Annual Report Download - page 77
Download and view the complete annual report
Please find page 77 of the 2008 Berkshire Hathaway annual report below. You can navigate through the pages in the report by either clicking on the pages listed below, or by using the keyword search tool below to find specific information within the annual report.-
 1
1 -
2
-
3
-
4
-
5
-
6
-
7
-
8
-
9
-
10
-
11
-
12
-
13
-
14
-
15
-
16
-
17
-
18
-
19
-
20
-
21
-
22
-
23
-
24
-
25
-
26
-
27
-
28
-
29
-
30
-
31
-
32
-
33
-
34
-
35
-
36
-
37
-
38
-
39
-
40
-
41
-
42
-
43
-
44
-
45
-
46
-
47
-
48
-
49
-
50
-
51
-
52
-
53
-
54
-
55
-
56
-
57
-
58
-
59
-
60
-
61
-
62
-
63
-
64
-
65
-
66
-
 67
67 -
 68
68 -
 69
69 -
 70
70 -
 71
71 -
 72
72 -
 73
73 -
 74
74 -
 75
75 -
 76
76 -
 77
77 -
 78
78 -
 79
79 -
 80
80 -
 81
81 -
 82
82 -
 83
83 -
 84
84 -
 85
85 -
 86
86 -
 87
87 -
88
-
89
-
90
-
91
-
92
-
93
-
94
-
95
-
96
-
97
-
98
-
99
-
100
 |
 |

Management’s Discussion (Continued)
Finance and Financial Products (Continued)
$25 million of losses arising from Hurricanes Gustav and Ike and $38 million from asset writedowns and plant closure costs.
Pre-tax earnings in 2008 also reflected the impact of lower home sales and higher interest expense from increased borrowings and
an increase in interest rates. Partially offsetting these declines was a $22 million gain from the sale of the housing community
division in the first quarter of 2008.
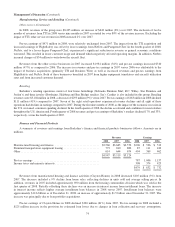
Revenues and pre-tax earnings from furniture and transportation equipment leasing activities in 2008 declined $37 million
(5%) and $24 million (22%), respectively, compared to 2007. The declines primarily reflected lower rental income driven by
relatively low utilization rates for over-the-road trailer and storage units, partially offset by the impact of a small furniture rental
business acquisition in 2008. Significant cost components of this business are fixed (depreciation and facility expenses), so
earnings declined disproportionately to revenues. Revenues and pre-tax earnings for 2007 decreased $70 million (8%) and $71
million (39%), respectively, as compared to 2006, primarily for the reasons previously stated.
Earnings from other finance business activities consisted primarily of interest income earned on fixed maturity investments
and from a small portfolio of commercial real estate loans. Pre-tax earnings in 2007 reflected a charge of approximately $67
million from the adverse effects of changes in mortality assumptions on certain life annuity contract liabilities. In 2006, pre-tax
earnings included income of $67 million from an equity purchase commitment fee.
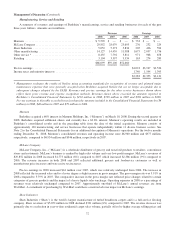
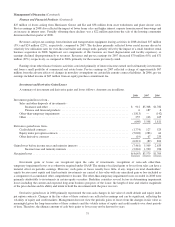
Investment and Derivative Gains/Losses
A summary of investment and derivative gains and losses follows. Amounts are in millions.
2008 2007 2006
Investment gains/losses from -
Sales and other disposals of investments -
Insurance and other ........................................................ $ 912 $5,308 $1,782
Finance and financial products ............................................... 6 187 6
Other-than-temporary impairments ............................................... (1,813) — (142)
Other ....................................................................... 255 103 165
(640) 5,598 1,811
Derivative gains/losses from -
Credit default contracts ......................................................... (1,774) 127 525
Equity index put option contracts ................................................. (5,028) (283) 64
Other derivative contracts ....................................................... (19) 67 235
(6,821) (89) 824
Gains/losses before income taxes and minority interests ................................... (7,461) 5,509 2,635
Income taxes and minority interests ........................................... (2,816) 1,930 926
Net gains/losses ................................................................... $(4,645) $3,579 $1,709
Investment gains or losses are recognized upon the sales of investments, recognition of non-cash other-than-
temporary-impairment losses or as otherwise required under GAAP. The timing of realized gains or losses from sales can have a
material effect on periodic earnings. However, such gains or losses usually have little, if any, impact on total shareholders’
equity because most equity and fixed maturity investments are carried at fair value with any unrealized gain or loss included as
a component of accumulated other comprehensive income. The other-than-temporary-impairment losses recorded in 2008 were
primarily attributable to investments in certain equity securities. Berkshire considers several factors in determining impairment
losses including the current and expected long-term business prospects of the issuer, the length of time and relative magnitude
of the price decline and its ability and intent to hold the investment until the price recovers.
Derivative gains/losses in 2008 primarily represented the non-cash changes in fair value of credit default and equity index
put option contracts. Changes in the fair values of these contracts are reflected in earnings and can be significant, reflecting the
volatility of equity and credit markets. Management does not view the periodic gains or losses from the changes in fair value as
meaningful given the long-term nature of these contracts and the volatile nature of equity and credit markets over short periods
of time. Therefore, the ultimate amount of cash basis gains or losses may not be known for years.
75